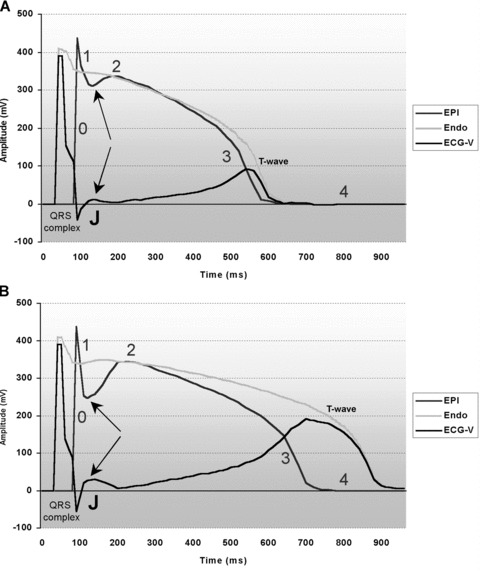
Figure 1.

Computational surface electrocardiogram waveform (ECG‐V) reconstruction as proposed by Antzelevich et al. 23 and based on vectorial difference between epicardial (EPI) and endocardial (ENDO) regional action potentials. EPI and ENDO action potentials were computationally reconstructed from actual and respective isolated canine heart action potentials. Numbers 0, 1 2, 3, and 4 in (A) and (B) represents respective action potential phases. (A) EPI and ENDO action potentials at 100 bpm, and receptive computational ECG‐V. Upward arrows points to post‐spike phase 1 dip. On ECG‐V, J point (J) is indicated by downward arrow. (B) EPI and ENDO action potentials at 60 bpm, and receptive computational ECG‐V. EPI shows pronounced “phase 1” magnitude (spike and dome shape, upward arrow points to post‐spike phase 1 dip). ENDO action potential shows less pronounced phase 1 magnitude, virtually unchanged as compared to 100 bpm pacing rate. On ECG‐V, note a pronounced notch (J wave, downward arrow) arising at the junction between reconstructed QRS complex and following ST segment, caused by marked regional EPI to ENDO phase 1 repolarization differences.
