
Figure 3.
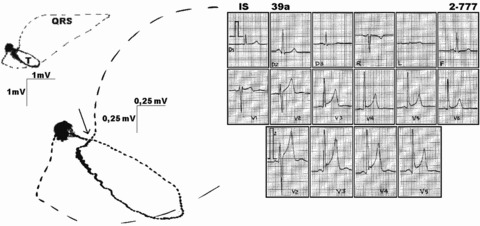
Typical electrocardiogram and respective vectorcardiogram in a healthy marathon runner. Note concave ST segment elevation on electrocardiogram, corresponding on vectorcardiogram to a take off of the zero potential at the QRS complex terminal loop (in detail—full arrow). Open droplets in vectorcardiogram loops indicate counterclockwise QRS complex and T‐wave loops orientations. Potential scales are, respectively, 1 mV and 0.25 mV on vectorcardiogram.