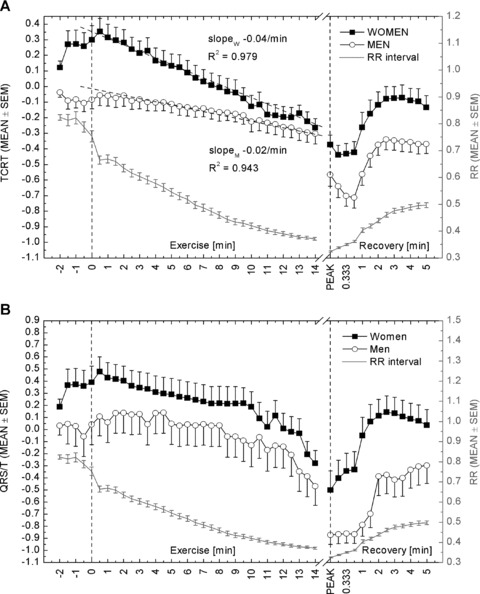
Figure 1.

Average TCRT (A) and QRS/T (B) values at different time instances throughout the measurement. Average RR intervals at corresponding time instances are included in both panels. The dotted vertical lines indicate the beginning of the exercise and the peak exercise, respectively. The first three samples after the exercise peak represent 10‐, 20‐, and 30‐seconds’ recovery. Otherwise, samples are 30 seconds apart from each other. After 3 minutes of recovery, the average TCRT and QRS/T values started to decline. Unfortunately, the recovery period was followed for only 5 minutes, and therefore the return to baseline level cannot be seen in the figure.
