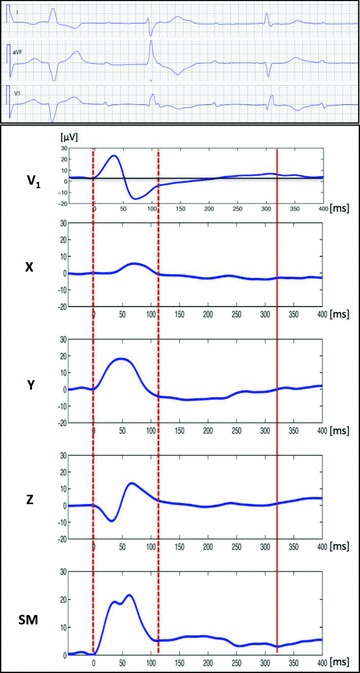
Figure 1.

Signal‐averaged orthogonal unfiltered PTa‐wave morphology in a patient with complete atrio‐ventricular block. Note the low‐amplitude and low‐frequency Ta repolarization wave that follows P wave (dotted lines), best seen in lead Y as well as in the spatial magnitude (SM) vector. While P‐wave onset is a very distinct event, the end of the P wave may be obscured by the superimposed Ta wave that affects the morphology of the P‐wave terminal part. Solid line indicates the end of the Ta wave. The upper panel represents ECG from standard leads I, aVF and V1 from the same patient.
