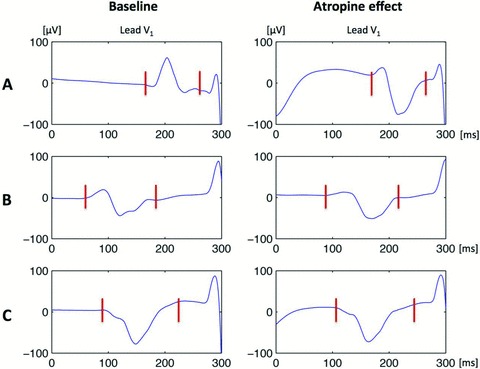
Figure 3.

P‐wave morphology change in lead V1 following i.v. atropine administration. Note the increase in amplitude of the negative terminal component seen in patients A (upright P wave at baseline) and B (biphasic P wave at baseline). Patient C who had negative P waves at baseline did not show any notable P‐wave morphology change despite heart rate increase in response to atropine administration.
