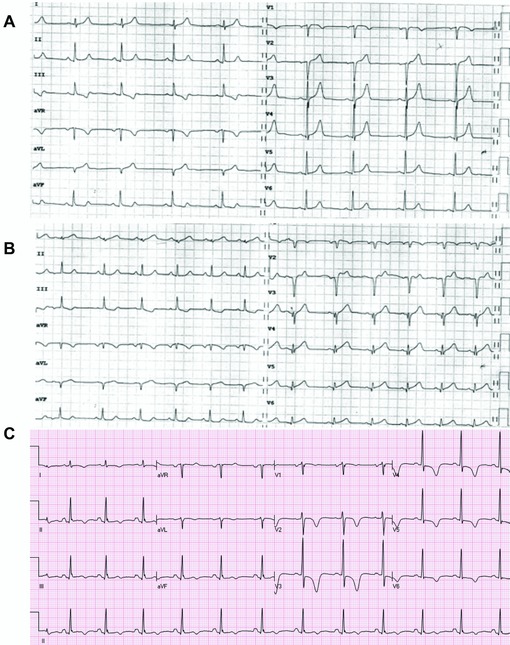
Figure 5.

(A) Presenting ECG of a patient with chest pain. There are tall symmetric T waves in V2–V4 without significant ST elevation. (B) Predischarge ECG of the same patient. There are now Q waves in leads V2–V3 and mild ST elevation in lead V2. T wave amplitude has decreased in the precordial leads. Coronary angiography showed subocclusion of the proximal part of the LAD. (C) An ECG of a patient after resolution of symptoms. There are symmetric deep negative T waves in the precordial leads without significant ST deviation (“Wellens” sign).
