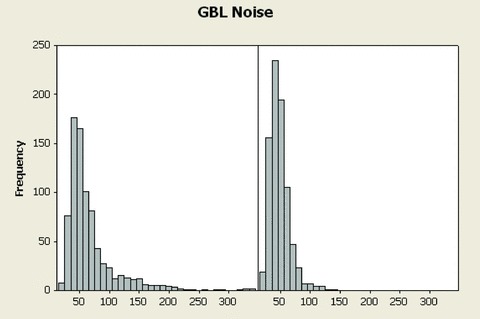
Figure 3.

Histograms of global (all frequencies) noise from the 821 ECGs using the fixed time point method (left panel) and using Antares (right panel). The distribution of global noise is overly shifted to the right‐hand side after optimized extraction by Antares.
