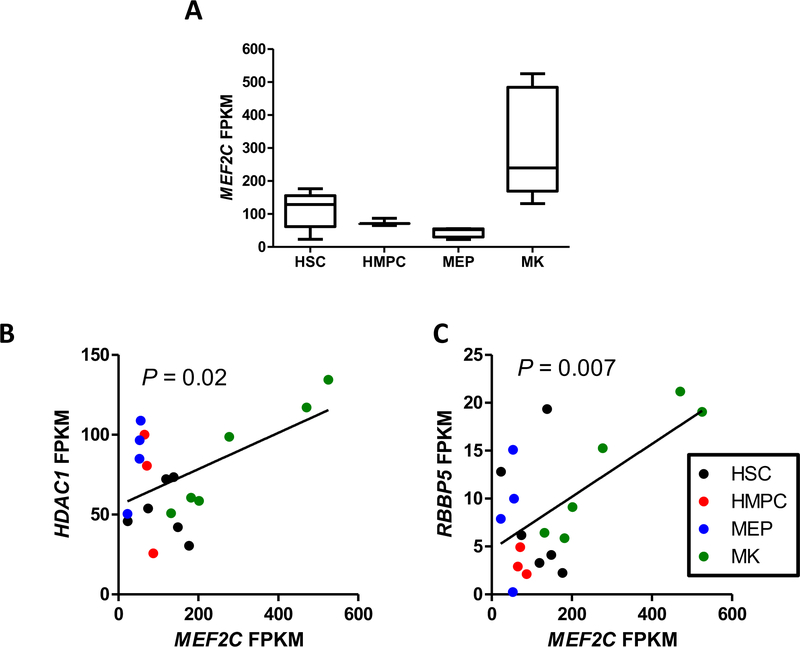
Fig 4. MEF2C expression levels correlate with HDAC1 and RBBP5 mRNA levels during hematopoiesis.
(A) MEF2C FPKM values from RNA-Seq data in hematopoietic stem cells (HSC), hematopoietic multipotent precursor cells (HMPC), megakaryocyte-erythrocyte precursors (MEP, and megakaryocytes (MK) from the BLUEPRINT project. Correlations between MEF2C levels and (B) HDAC1 and (C) RBBP5 levels.

