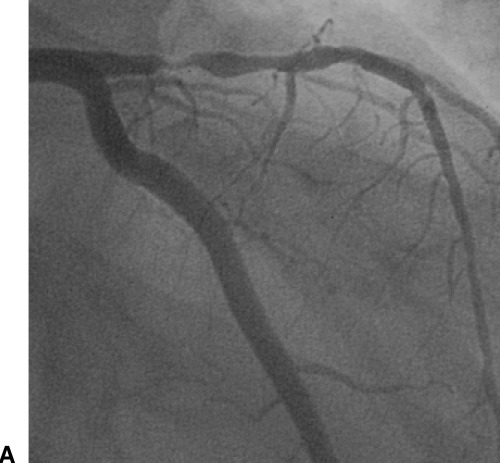
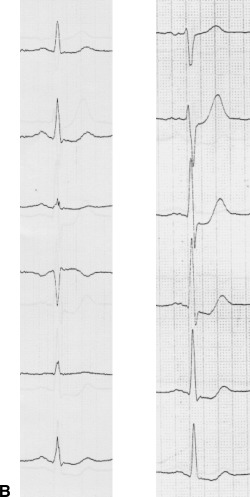
Figure 2.


A patient in group II. (A) Angiography shows tight stenosis of the proximal left anterior descending coronary artery. (B) ECG (extremity leads left, precordial leads right) shows ST‐segment depression with positive T wave maximally in leads V3–5 (regional subendocardial ischemia).
