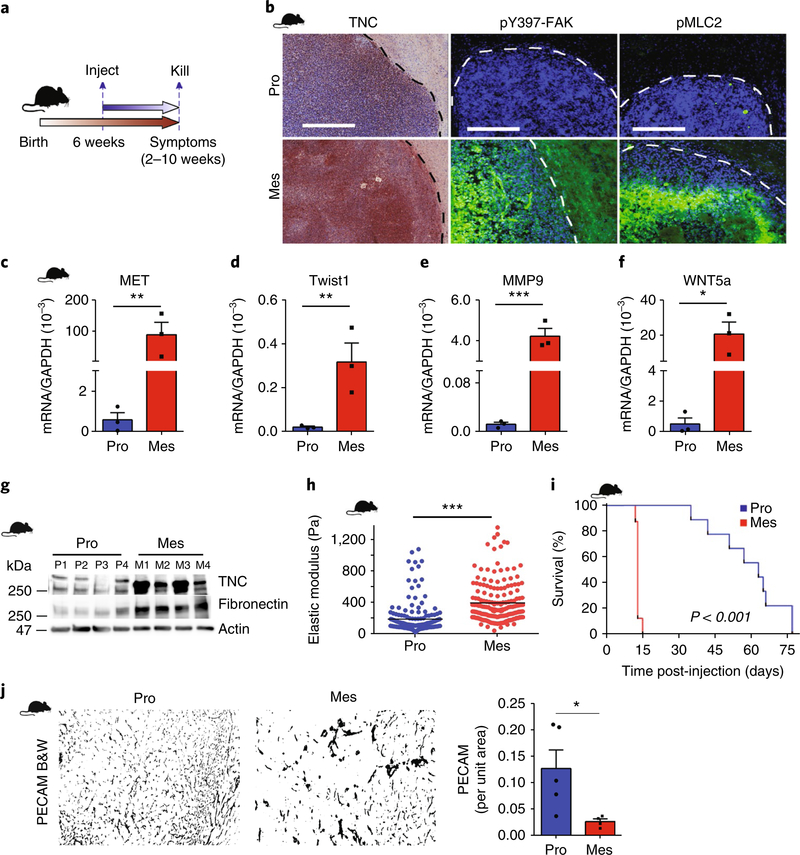
Fig. 2 |. GBM aggression is associated with a mesenchymal-like phenotype and elevated tissue tension.
a,b, Schematic of the xenograft model experimental setup (a) and immunohistochemistry (TNC) and immunofluorescence (b) for the analysis of pY397-FAK and pMLC2 in xenografts of human proneural (Pro) and mesenchymal (Mes) GBMs injected intracranially into NCR nude mice. Broken lines delineate tumour—haematoxylin or DAPI (4,6-diamidino-2-phenylindole)-dense areas—from normal brain. Image representative of three mice per group. Scale bars, 250 μm. c–f, RNA from these xenografts was analysed by qPCR for the indicated transcripts. Mean ± s.e.m.; n = 3 mice per group. **P = 0.008 (MET), **P = 0.001 (Twist), ***P = 4.64 × 10⁻⁵ (MMP9) and *P = 0.01 (WNT5a) by two-sided unpaired t-test. g, Immunoblot of TNC and fibronectin in lysates of proneural (n = 4 samples, P1–4) and mesenchymal (n = 4 samples, M1–4) xenografts. h, ECM stiffness (measured as elastic modulus) measured by AFM in proneural (n = 4 tissue samples; three 90 × 90 μm regions per sample, 191 indentations) and mesenchymal (n = 4 tissue samples, three 90 × 90 μm regions per sample, 192 indentations) xenograft tissue. Each point represents force per indentation. Mean ± s.e.m.; ***P = 1.65 × 10⁻¹⁵ by two-sided Mann–Whitney U-test. i, Kaplan–Meier analysis of nude mice injected with human proneural or mesenchymal GBM cells (n = 9 mice per group). P value calculated using a two-sided logrank test. j, Representative images and quantification of PECAM in proneural and mesenchymal xenograft tissue (n = 5 and 4 mice per group for proneural and mesenchymal, respectively). B&W denotes black and white images post-masking of PECAM-stained blood vessels. Mean ± s.e.m.; *P = 0.03 by two-sided Mann–Whitney U-test.

