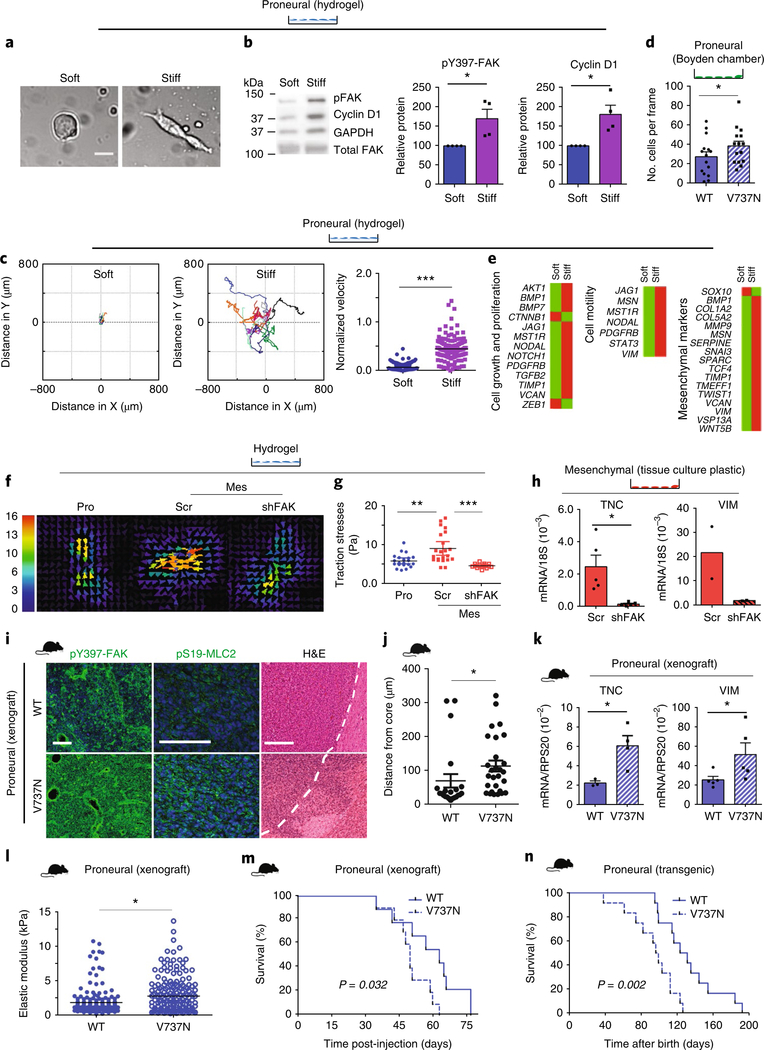
Fig. 3 |. Mechanosignalling drives a mesenchymal phenotype.
a, Proneural cells on soft and stiff hydrogels after 48 h (n = 3 independent experiments). Scale bar, 20 μm. b, pY397-FAK and cyclin D1 expression in proneural cells. Mean ± s.e.m.; n = 4 independent experiments, normalized to GAPDH. *P = 0.032 and 0.04 for pY397-FAK and cyclin D1, respectively, by one- and two-sided paired t-test. c, Migration tracking (left) of proneural cells on hydrogels; n = 10 (soft) and 11 (stiff) cells pooled from 3 independent experiments. Velocity plot (right) represents distance per time per frame; n = 144 frames per condition. Mean ± s.e.m.; ***P = 2.72 × 10–41 by two-sided paired t-test. d, Proneural cells expressing wild-type integrin β1 (WT) or V737N integrin β1 mutant (V737N) assayed for invasion. Each point represents invasive cells per frame; n = 15 frames. Mean ± s.e.m.; *P = 0.011 by two-sided paired t-test. e, qPCR array and pathway analysis of proneural cells on hydrogels; n = 2 independent experiments. f,g, A representative traction map; the colour bar represents increasing magnitude of stress with 0 (blue) denoting low stress and 16 (red) denoting high stress regions of the cell (f) and traction stresses (g) of proneural (Pro), control (Scr) or FAK knockdown (shFAK) mesenchymal cells (Mes) on 2.7 kPa hydrogels analysed by traction force microscopy. Mean ± s.e.m. of traction forces; n = 15 (shFAK) and 21 (all others) measurements, pooled from 3 independent experiments. **P = 0.0015 and ***P = 2.73 × 10⁻⁵ by two-sided Mann–Whitney U-test. h, qPCR results for mesenchymal Scr and shFAK cells; n = 5 and 2 independent experiments for TNC and vimentin (VIM), respectively. Mean ± s.e.m.; *P = 0.036 by two-sided paired t-test for TNC. i, Stained xenografted tissue from proneural tumours expressing WT or V737N. Scale bars, 100 μm pY397-FAK and pS19-MLC2; 250 μm H&E (n = 4 mice per group). j, Local invasion was quantified. Mean ± s.e.m.; n= 22 and 28 distance measurements for WT and V737N tumours, respectively, for 4 tissues per group. *P = 0.0012 by two-sided unpaired t-test. k, RNA from these tumours was analysed. Mean ± s.e.m.; n = 4 and 5 mice per group for TNC and vimentin, respectively. *P = 0.002 (TNC) and 0.032 (vimentin) by two-sided unpaired t-test. l, ECM stiffness for n = 3 tissues per group, 90 × 90 μm. Scatter represents 192 indentations per sample. Mean ± s.e.m.; *P = 0.022 by two-sided Mann–Whitney U-test. m,n, Survival of xenografted (m) and transgenic (n) mice overexpressing WT or V737N; n = 9 WT and 10 V737N (xenografts); n = 12 mice per group (transgenic). P value calculated using two-sided logrank test. Source data: Supplementary Table 4; unprocessed blot: Supplementary Fig. 9.

