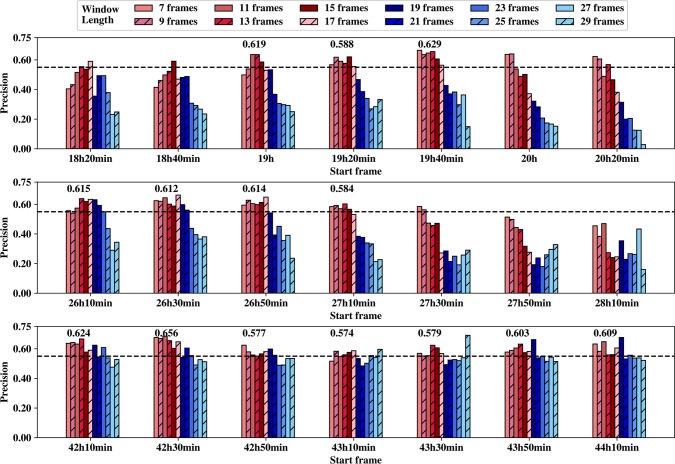
Fig 3. Time window selection.
The three subplots represent the precision values for different time windows based on 21 start frames (x axis) and 12 window lengths (7 frames to 29 frames) for phases 1, 2, and 3 (from top to bottom) respectively, and the black bash line in each subplot indicates a precision value of 0.55.

