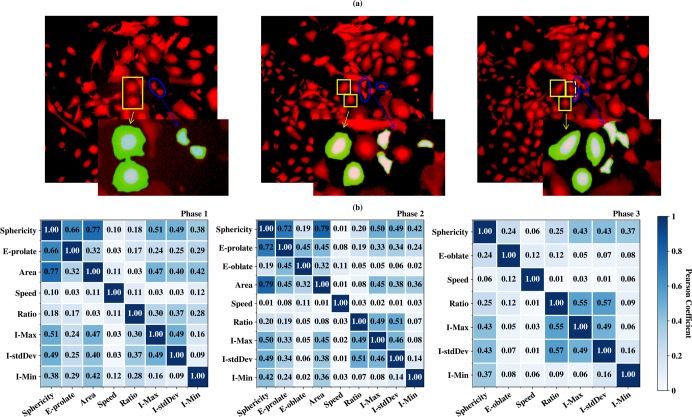
Fig 5. iPS progenitor cells vs. MEFs and feature correlation.
(a) shows the examples of iPS progenitor cell images (blue circles) and normal MEFs images (yellow boxes) taken from phase 1, 2 and 3 of field 2 (Left, middle and right). Nucleus and cytoplasm of the enlarged progenitor cells and normal MEFs are colored in light blue and green respectively. (b) shows the Pearson coefficients between remaining types of features in three phases after the first step of feature selection. Note in this figure ellipsoid-prolate is denoted as E-prolate, intensity-StdDev as I-stdDev, intensity-min as I-Min, intensity-max as I-Max, nucleus-cytoplasm volume ratio as Ratio, ellipsoid-oblate as E-oblate.

