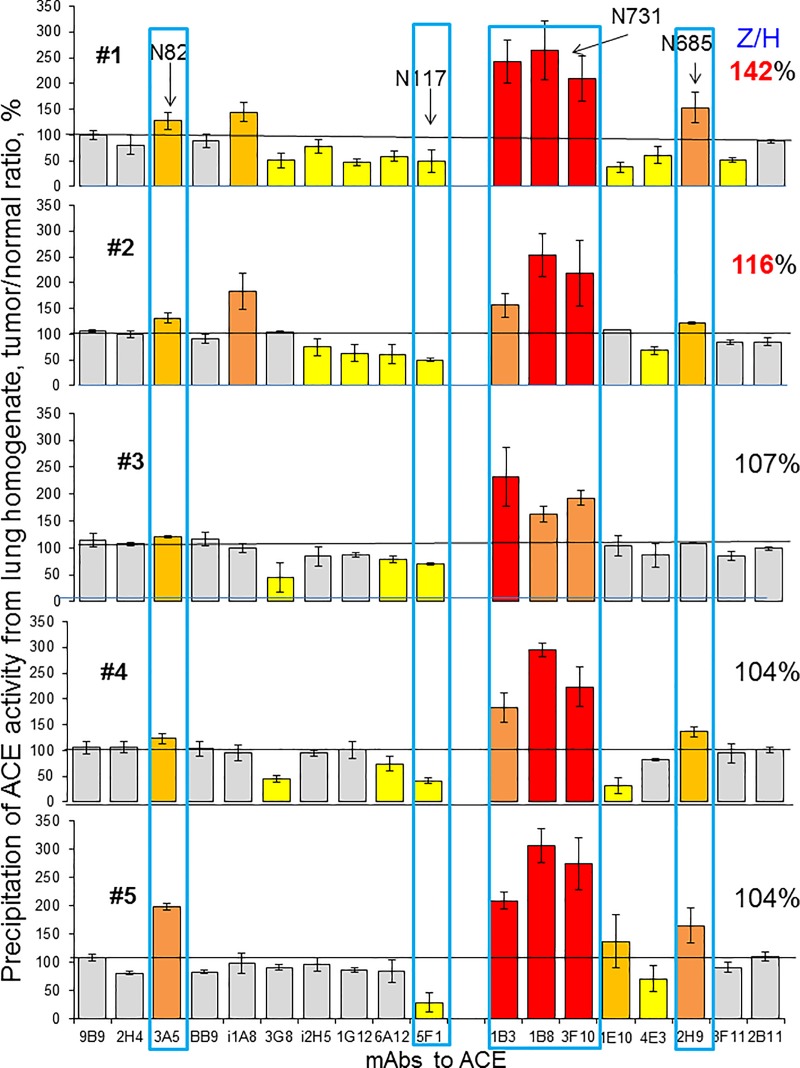
Fig 4. ACE conformation in lung cancer (conformational fingerprinting of ACE).
ACE activity was precipitated by 17 different mAbs from five individual homogenates of tumor lung tissues and their morphologically normal lung counterparts. Immunoprecipitated ACE activity is presented as a normalized value (Tumor/Normal ratio), to highlight differences in immunoprecipitation pattern of ACE from different homogenates by different antibodies. ACE activity in these 10 homogenates was quantified before immunocapture and ZPHL/HHL ratio was calculated and presented as a percentage of a value for morphologically normal tissues–values on the right side of the data for each patient. Data presented as a mean of at least 2–3 independent experiments in duplicates. Ratio increased more than 20% are highlighted with orange, more than 50% -with brown and more than 100%—with red. Bars highlighted with yellow- ratio decreased more than 20%, with blue—decreased more than 50%. Bars were highlighted if values were statistically significant (* p<0.05).

