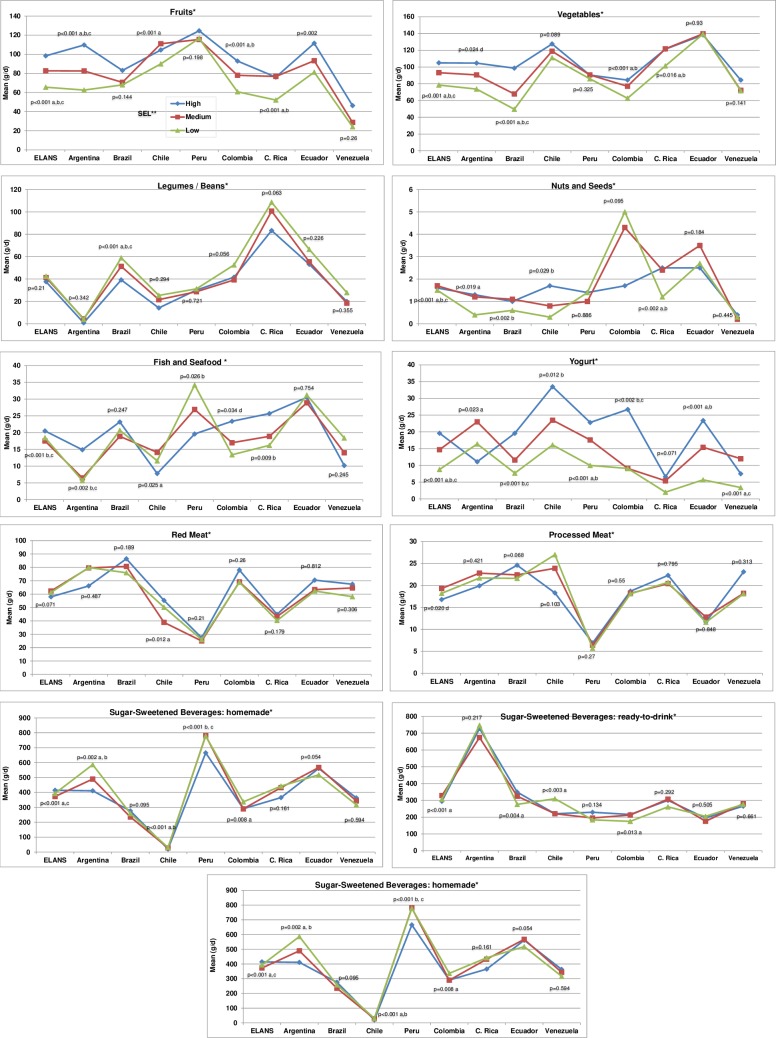
Fig 2. Overall consumption of the major food groups by country and socioeconomic level.
*Food Groups: food or beverages with demonstrated associations with NCDs. Nationally representative data from the urban population, 15–65 years old, obtained from the ELANS by the average of two non-consecutive 24-HR, ** SEL: socioeconomic level: H: High; M: Middle; L: Low. p values by Kruskal Wallis test: a low vs middle (p<0.05); b low vs high (p<0.05); c middle vs high (p<0.05)–all adjusted for multiple testing (using the Bonferroni error correction). d No statistical differences were found after comparisons between groups, adjusted for multiple testing.

