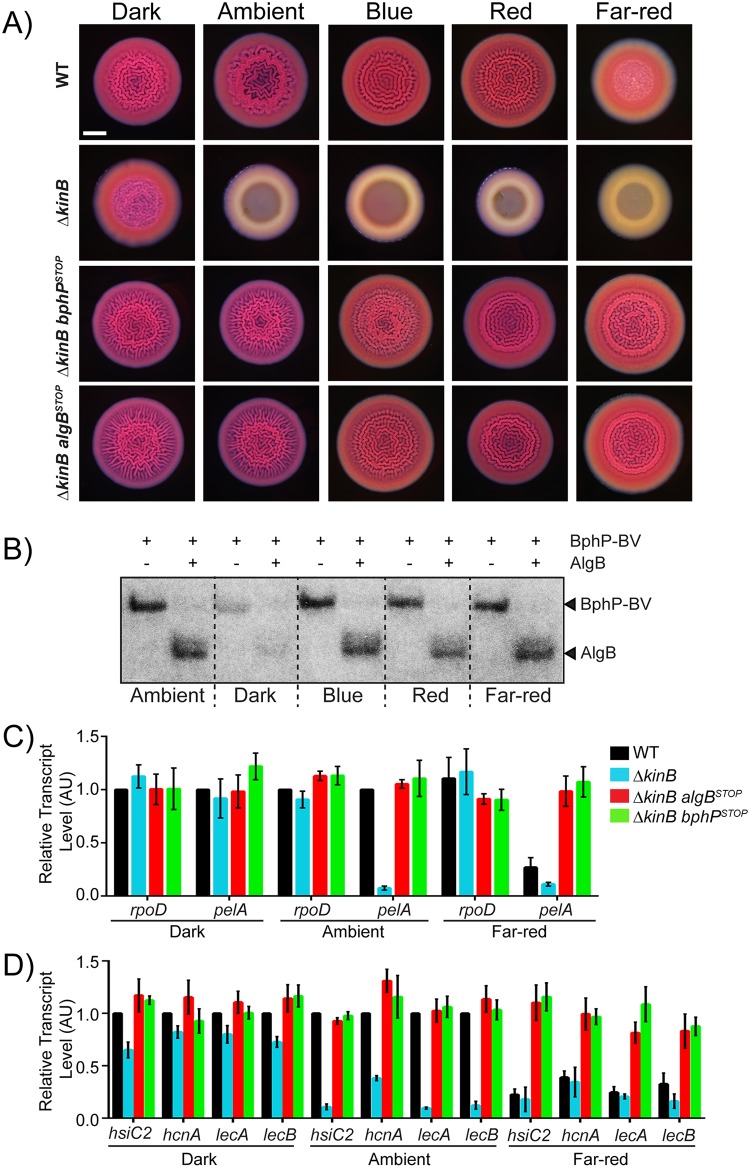
Fig 4. Photosensing, via the BphP–AlgB phosphorelay, represses group behaviors in P. aeruginosa.
(A) Colony biofilm phenotypes are shown for WT PA14 and the designated mutants on Congo red agar medium after 72 h of growth under the indicated light conditions. Scale bar is 2 mm for all images. (B) Autophosphorylation of the BphP–BV complex was carried out for 30 min (left lane in each pair), followed by addition of AlgB (right lane in each pair) for an additional 30 min under the indicated light conditions. (C) Relative expression of rpoD and pelA as measured by qRT-PCR in WT PA14 and the designated mutant strains grown as colony biofilms as in (A) in darkness, ambient light, and far-red light. (D) Relative expression of hsiC2, hcnA, lecA, and lecB measured by qRT-PCR in WT PA14 and the designated mutants grown as colony biofilms as in (A) and light conditions as in (B). For panels B and C, data were normalized to 16S RNA levels, and the WT levels were set to 1.0. Error bars represent SEM for 3 biological replicates. Data for panels C and D can be found in supplemental file S1 Data. The original autoradiograph with the data for panel B is available in supplemental file S2 Data. AU, arbitrary unit; BV, biliverdin; qRT-PCR, quantitative Reverse Transcriptase-Polymerase Chain Reaction; SEM, standard error of the mean; WT, wild type.

