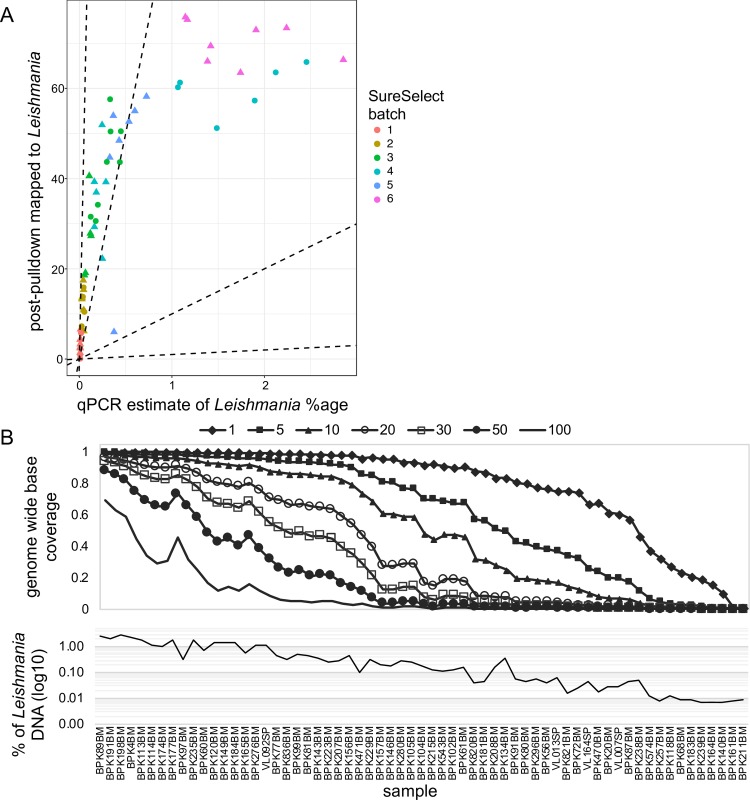
Fig 1. Performance of SuSL-sequencing on clinical samples.
A. Enrichment of Leishmania DNA from clinical samples by SureSelect; Y axis shows percentage of reads mapping to the L. donovani reference genome following SureSelect enrichment. X axis is the pre-enrichment percentage of Leishmania DNA, estimated by either whole-genome sequencing or qPCR; dotted lines indicate no enrichment and 10-, 100- and 1000-fold enrichment. B. Read mapping statistics in the 63 samples after SureSelect enrichment. Upper panel shows evenness of genome coverage as the proportion of bases covered with a minimum of number of sequencing reads from 1 to 100 as indicated by the seven different lines. Lower panel shows the percentage of reads mapping to the Leishmania reference genome for each sample, shown on the x-axis. The x-axis is common to both panels. BM, Bone Marrow; SP, Spleen aspirate.

