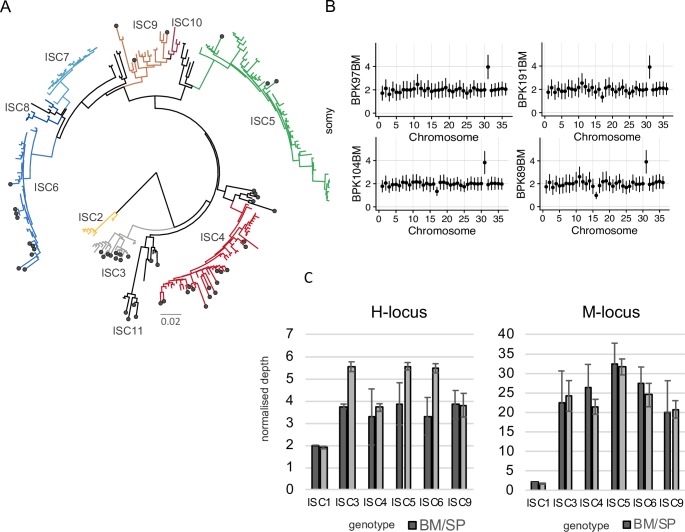
Fig 2. Genomic diversity among clinical samples.
A. SNPs. Phylogenetic tree based on SureSelect enriched clinical samples (black circle) and previously sequenced isolates [8]. Diagram is a neighbor-joining phylogeny based on 197 variable sites. ISC2-ISC10 were sub-populations previously defined [8]; ISC11 is a novel group that includes clinical samples and isolates previously designated as ‘ungrouped’. Full sample identifiers are shown in S5A Fig. B. Karyotypes (High quality samples). Y axis shows normalized somy estimate for each chromosome (x axis). Points show central estimate and bars show one standard deviation around these estimates, calculated by the binned depth method. C. Local CNVs. Average copy number per cell of H- and M-loci per ISC group in SureSelect enriched clinical samples (Bone Marrow or Spleen aspirate; BM/SP) and in cultured isolates (promastigotes, Prom). Error bars show one standard deviation around the mean estimate. Only a single sample was available from bone marrow aspirates in ISC1, hence no standard deviation is shown.

