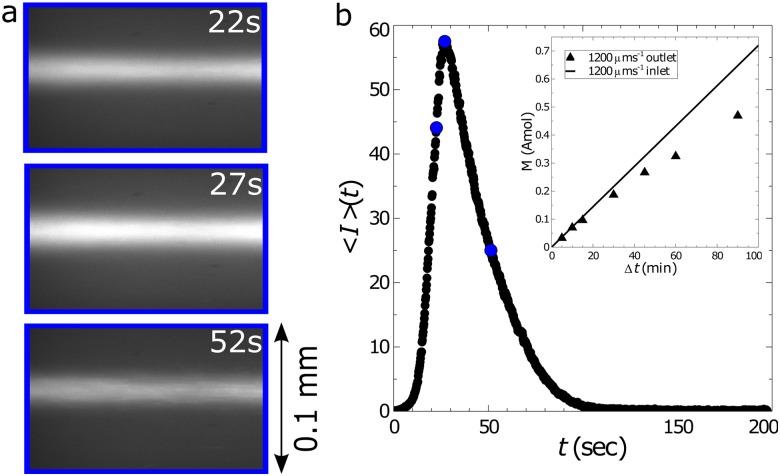
FIG. 3.
(a) Example images showing fluorescent DNA passing through the outlet [blue region in Fig. 1(a)] of the channel after having been trapped for a total time of . The DNA was suspended in buffer solution 8 and was trapped using in. and ( and ). (b) The mean intensity calculated from each image following the release of the trap at . The blue circles correspond to the mean intensities from the images in (a). The subplot compares the total moles of DNA trapped (symbols) with the theoretical maximum (line) as a function of the elapsed time of trapping, .

