FIG. 3.
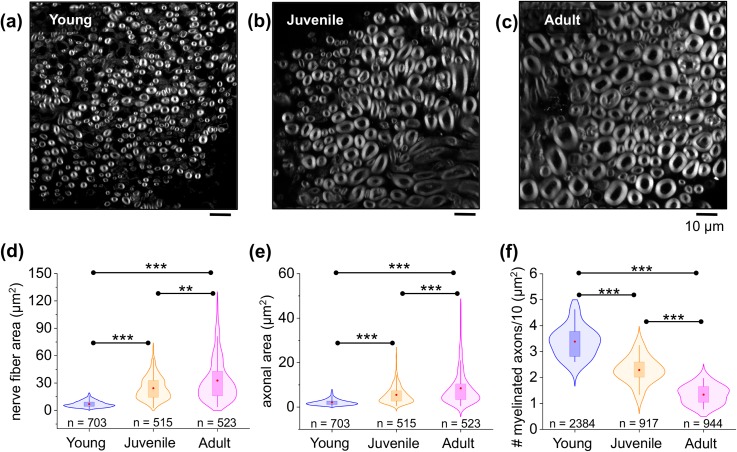
Morphometrical characterization of mouse peripheral nerve microarchitecture during development. Representative confocal microscopy images showing sciatic nerve cross-sectional tissue slices in (a) young, (b) juvenile, and (c) adult mice. Myelinated axons are shown in gray. (d) and (e) Violin plots showing distribution with overlaid box-plots comparing the total nerve fiber area (axonal area + myelin area) and axonal area from young to adult mice. Red dot = mean; box = 25th and 75th percentile. n indicates the total number of nerve fibers measured. A total number of 5 animals and 15 nerve slices were analyzed per condition. (f) Density of myelinated axons in young, juvenile, and adult nerve tissue. n indicates the total number of myelinated fibers counted in 11 nerve sections from 3 different mice per developmental stage. ** shows a significant difference with p < 0.001 and *** with p < 0.0001 obtained using the Mann-Whitney test [(d) and (e)] and paired two-tailed test (f).

