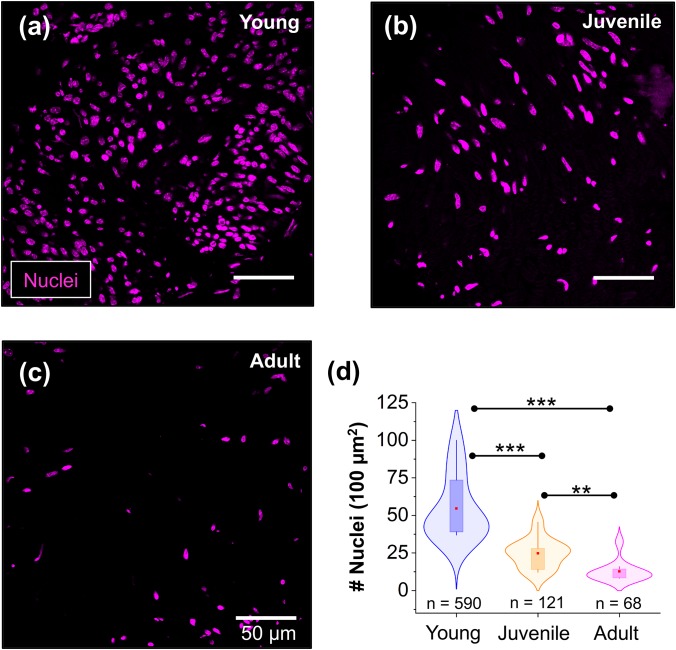
FIG. 4.
Analysis of cell body densities in sciatic nerves at different stages of nerve maturation. (a)–(c) Representative confocal microscopy images of peripheral nerve cross sections showing the distribution of cell bodies. Cell nuclei were labeled with DAPI (magenta). (d) Violin plots with overlaid box-plots show that cell body density decreases in peripheral nerves during development. Red dot = mean; box = 25th and 75th percentile. n indicates the number of nuclei measured in 11 nerve sections from 3 different mice per developmental stage. ** indicates a significant difference with p < 0.001 and *** with p < 0.0001 obtained using a Mann-Whitney test.

