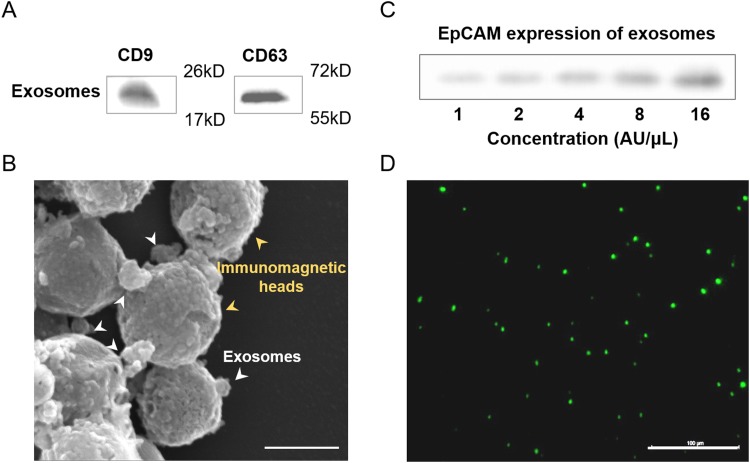
FIG. 4.
Characterization of immunomagnetic capture in the microfluidic device. (a) Expression of CD9 and CD63 protein of exosomes using western blot analysis. (b) Scanning election micrographs of immunomagnetic beads after immunoaffinity capture. Scale bar: 100 nm. (c) Expression of EpCAM protein of exosomes (undiluted, serially diluted to 1:2, 1:4, 1:8, 1:16) isolated from the cell culture medium using western blot analysis. The initial concentration was defined as 16 AU/μl. (d) Fluorescence image of exosomes after being captured by immunomagnetic beads. The exosomes were signed using EpCAM-FITC before being observed by a fluorescence microscope. Scale bar: 100 μm.

