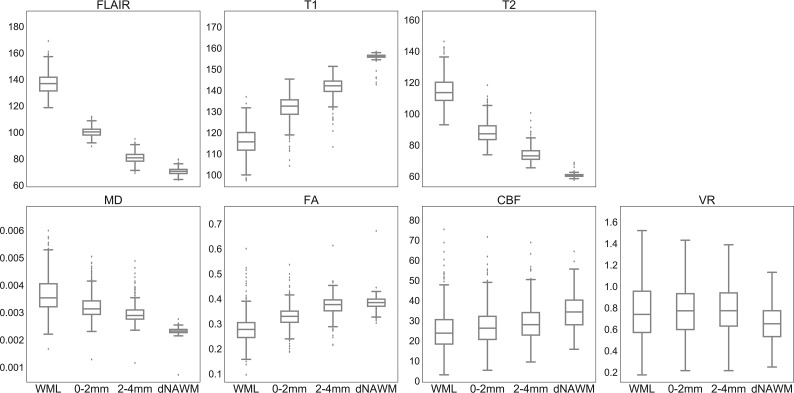
Fig 2.
Boxplots of mean intensity values for each region. CBF is measured in cubic millimeters/100 g/min, and VR shows the mean percentage signal change. For vascular reactivity, outliers are excluded (comprising ∼10% of the sample) to better demonstrate differences among means. A graph with outliers is available (On-line Fig 2). For each parameter, mean values are significantly different among all pair-wise comparisons between ROIs with corrected P < .001, except for VR in which comparison of WML and dNAWM shows corrected P = .001, and there is no significant difference among WMLs and the 2 penumbra regions (P > .4).

