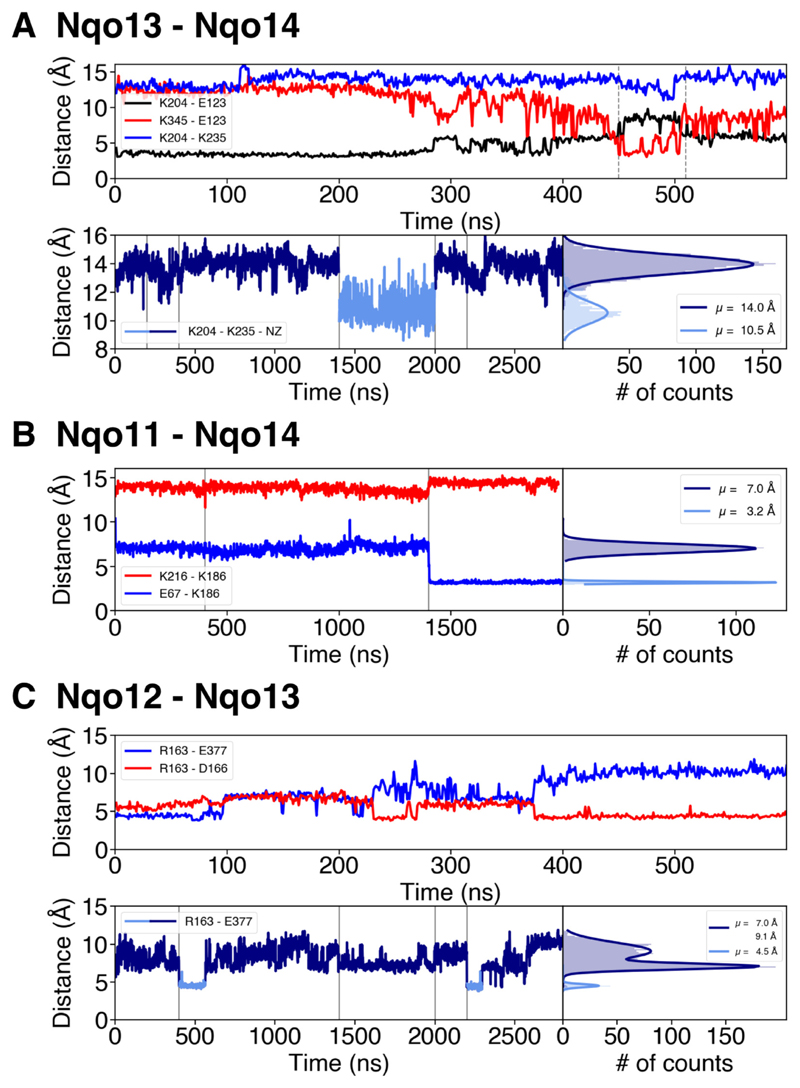
Fig. 3.
Ion-pair dynamics at the subunit interfaces in the membrane domain of complex I. A) The Nqo13 – Nqo14 interface. Upper panel: Distances of the Lys13-204/Glu13-123 ion pair (in black), the Lys14-345/Glu13-123 ion pair (in red) during 0.6 μs of MD simulation (simulation 5). The flip of the ion pair correlates with a decrease in the Lys13-204/Lys13-235 distance (in blue). Lower panel: Lys13-235/Lys13-204 distances and their distribution during 2.8 μs of dynamics (simulations 1 to 5). The dark blue curve represents a ‘repulsive’ regime where both residues are positively charged, whereas deprotonation of Lys13-204 leads to sampling of shorter distances (light blue curve). Vertical grey lines indicate boundaries between separate simulations. B) The Nqo11 – Nqo14 interface. Distances of the Glu11-67/Lys14-186 (in blue) and Lys14-186/Lys14-216 (in red) ion pairs during 2 μs MD simulations (simulations 1, 2, 5) and the distribution of the distances between Glu11-67/Lys14-186 during the MD simulations. Upon deprotonation of Glu11-67 at 1.4 μs, the inter-subunit contact forms, which correlates with an increase in the Lys14-186/Lys14-216 distance. Deprotonation of Glu11-67 leads to formation of contact with Lys14-186. C) The Nqo12 – Nqo13 interface. Upper panel: Distances of the Arg12-163/Glu13-377 (in blue) and the Arg12-163/Asp12-166 (in red) ion pairs during 0.6 μs of MD simulation (simulation 5). Arg12-163 forms inter- and intra-subunit salt-bridges. Lower panel: Distances between Arg12-163/Glu13-377 during 2.8 μs of simulation (simulations 1 to 5) and their respective distribution. Intra-subunit and intermediate states are drawn in dark-blue and the inter-subunit state in light blue. Vertical grey lines indicate boundaries between separate simulations.

