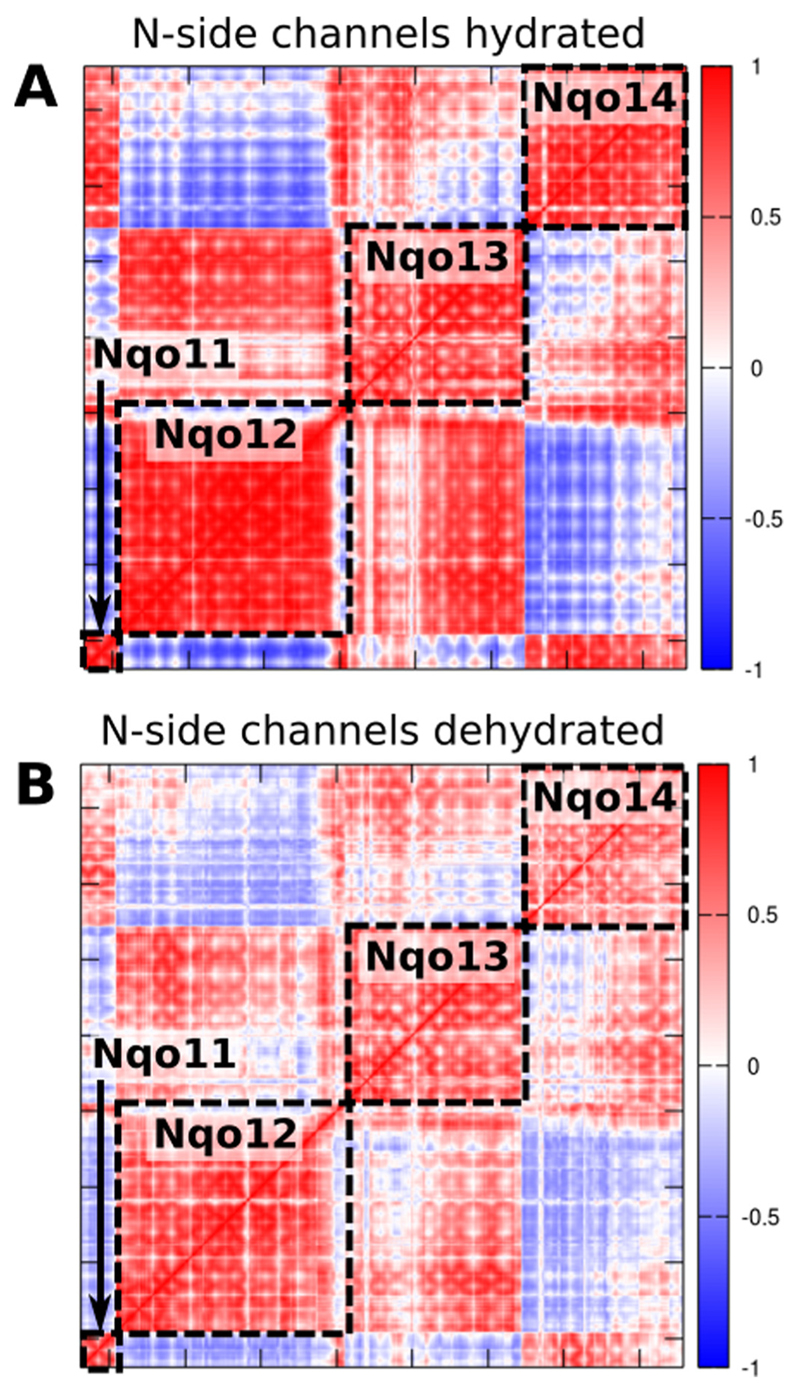
Fig. 5.
Correlation matrices of the membrane domain of complex I obtained from principal component (PC) analysis of the MD simulation data (simulations 2 and 4, Table S1). Correlation of PCs A) with open channels between the N-side bulk water and central Lys residues, B) upon deprotonation of the central Lys residues and closure of the N-side channels. Neutralization and/or dehydration of the subunits cause a decreased coupling between subunits. The colors refer to the inter-residue correlation from 1 (directly correlated), to −1 (anti-correlated).

