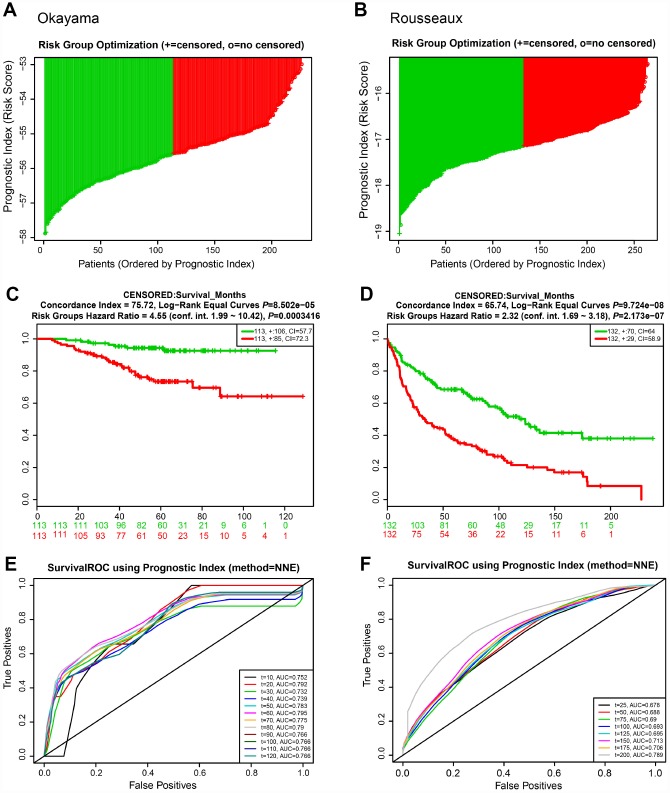
Figure 6.
Risk scores of 22-autophagy gene signature were significantly associated with survival in the Okayama and Rousseaux cohorts. The distribution of risk score (A), Kaplan-Meier survival curve (C), and ROC curve (E) for the Okayama cohort. The distribution of risk score (B), Kaplan-Meier survival curve (D), and ROC curve (F) for the Rousseaux cohort.

