Figure 3.
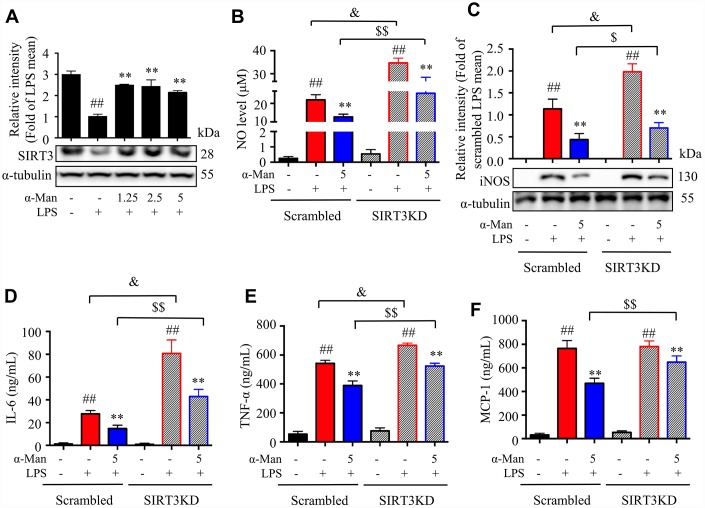
Effects of α-Man in LPS stimulated SIRT3-knockdown RAW264.7 macrophages. (A) The protein expression of SIRT3 was determined by Western blot in LPS-induced RAW264.7 macrophages. α-Tubulin was used as an internal loading control. Data are normalized to the mean value of LPS group. (B) NO production was determined by Griess reagent. (C) iNOS abundance was measured by Western blot. α-Tubulin was used as an internal loading control. Data are normalized to the mean value of scrambled LPS group. The levels of IL-6 (D), TNF-α (E) and MCP-1 (F) were determined by ELISA kit. Data are shown as means ± SD (n = 5). ##P < 0.01, LPS vs. DMSO, **P < 0.01, α-Man + LPS vs. LPS, &P < 0.05, SIRT3KD LPS vs. scrambled LPS, $P < 0.05, $$P < 0.01, SIRT3KD α-Man vs. scrambled α-Man.

