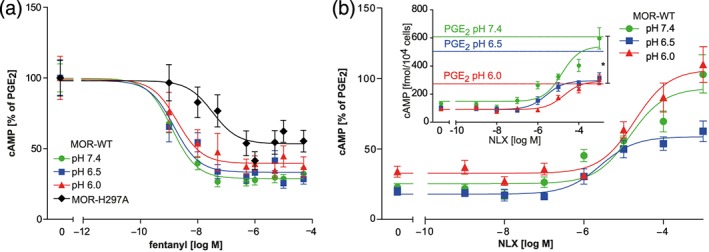
Figure 4.

Dependence of cAMP modulation on pH and H2976.52. (a) Fentanyl‐induced cAMP reduction in HEK MOR‐WT and in HEK MOR‐H2976.52A. Data represent means ± SEM of cAMP accumulation in % of the values obtained with PGE2 alone at the respective pH, and non‐linear fit; n = 6 per curve. Derived parameters are shown in Table 3 (upper panel); significant differences (P < .05) between MOR‐WT pH 7.4 and MOR‐H2976.52A (logEC50 and Top). (b) Naloxone antagonism of fentanyl‐induced cAMP inhibition in HEK MOR‐WT. Data represent means ± SEM in % of PGE2‐induced baselines at the respective pH (inset: same data before normalization in fmol/104 cells with PGE2‐stimulated baselines) with non‐linear fit; n = 6 per curve. Derived parameters are shown in Table 3 (lower panel), significant differences (P < .05) were found between pH 6.5 and pH 7.4 (logEC50 and Top)
