FIGURE 2.
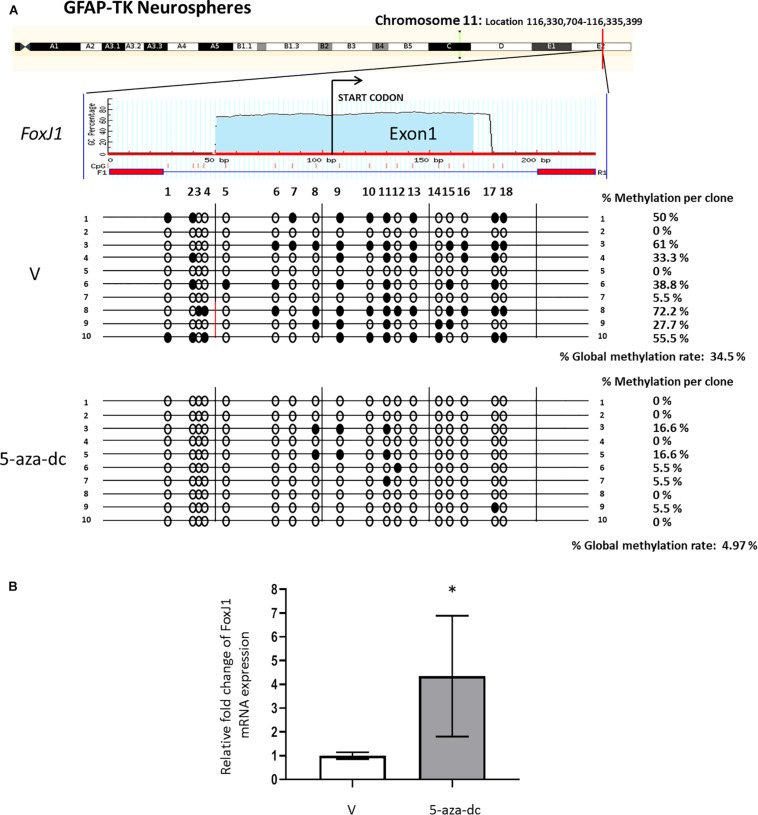
Identification and analysis of FoxJ1 CpG island GFAP-TK mouse spinal cord-derived neurospheres cultured in vitro. (A) GFAP-TK neurospheres cultured for 2 weeks were treated with vehicle (DMSO [V]) or 5-aza-dc for 48 h. A schematic of the FoxJ1 CpG island is shown at the top for reference with the transcription start point indicated by an arrow. Each row represents an individually cloned and sequenced allele following sodium bisulfite DNA modification. Ten clones were analyzed per condition. The grade of the individual CpG island methylation for each clone and the global methylation per condition is indicated as a percentage of methylation. Vertical lines beneath the horizontal line indicate the distributions and densities of CpG sites. CpG sites are marked as circles to accurately reflect the CpG density of the region, with empty circles for unmethylated CpG sites and filled circles for methylated CpG sites. (B) FoxJ1 relative mRNA expression was determined by real-time PCR, and the values normalized to GAPDH. Values are represented as mean ± SD, n = 6. ∗p < 0.05 determined by Student’s t-test was considered statistically significant.

