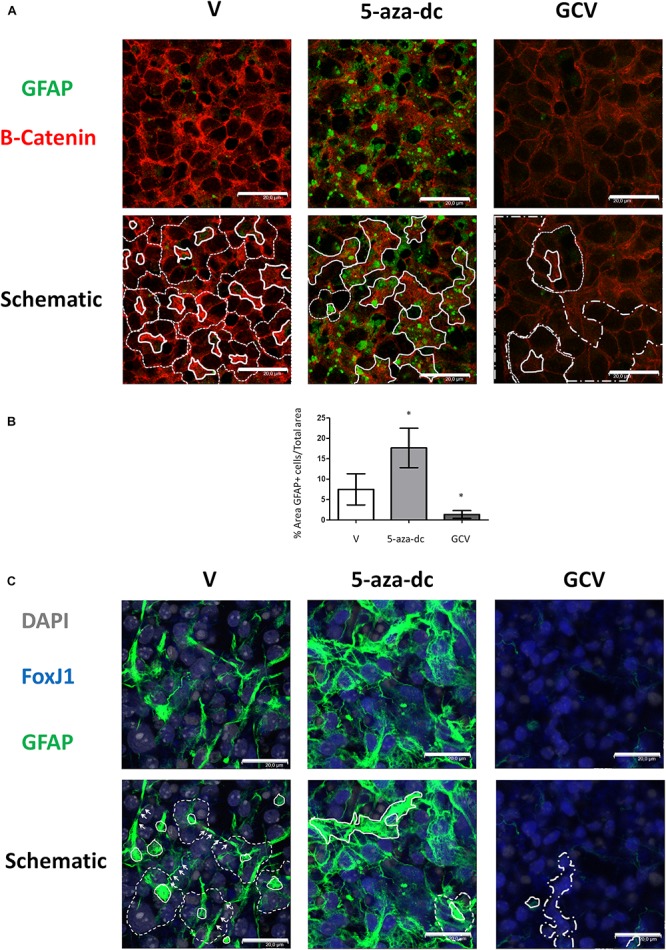
FIGURE 4.

GFAP astrocyte marker expression in GFAP-TK mouse spinal cord-derived neurospheres cultured in vitro and treated with 5-aza-dc or GCV. (A) GFAP-TK neurospheres were treated with vehicle (DMSO [V]), 5-aza-dc, or GCV. The GFAP signal was obtained by using a rabbit polyclonal anti-GFAP antibody that marks astrocytes (green) while the β-catenin signal delineates cell borders (red). Pinwheel structures identified are marked with dashed lines indicating the periphery of ependymal cells and a solid white line indicating the core (schematic). In 5-aza-dc treatment, the continuous lines mark the core of pinwheel and aberrant accumulations of GFAP-positive cells (schematic). In GCV treatment, dashed and dotted lines mark regions of accumulated large cells (schematic). Scale bars, 20 μM. (B) Percentage of GFAP positive areas in twenty regions over multiple experiments (mean ± SD) were calculated for each condition using ImageJ software and compared to total area. ∗p < 0.05 determined by Student’s t-test was considered statistically significant. (C) The GFAP signal obtained by using a chicken polyclonal anti-GFAP antibody marks astrocytes (green), the FoxJ1 signal (blue) and the nuclear marker DAPI (gray). Lateral extensions of astrocyte connecting with astrocytes from adjacent cores are indicated by arrows. Scale bars, 20 μM.
