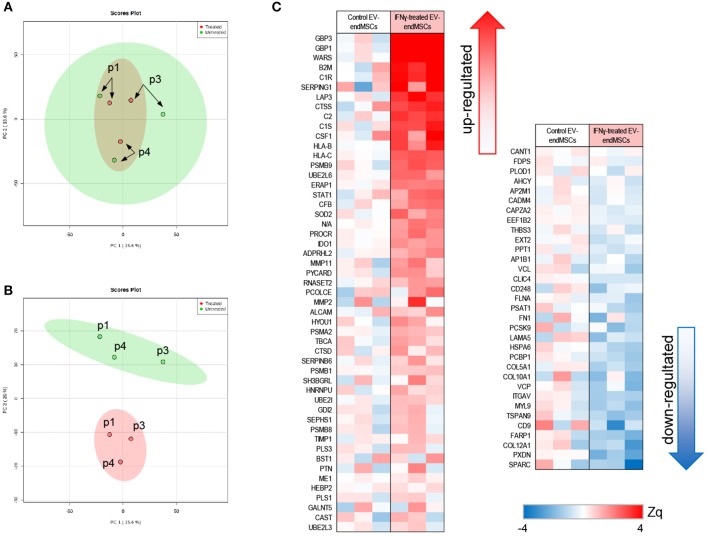
Figure 4.
Quantitative proteomic analysis of IFNγ/EV-endMSCs. A total of 895 proteins (number of peptides, Np, >2 at 1% FDR) quantified after iTRAQ proteomic approach were first subjected to Principal Component Analysis (PCA). (A) Score plot for PC1 (35.6% variance explained) vs. PC2 (33.6% variance explained). (B) Score plot for PC1 (35.6% variance explained) vs. PC3 (20% variance explained). Data display 95% confidence regions. Patient origin (n = 3) are indicated on the plots as p1, p3, and p4. IFNγ/EV-endMSCs (treated) and EV-endMSCs (untreated, control) samples are indicated in red and green, respectively. (C) Quantitative proteomics results. Protein profile changes were analyzed by WSPP model (Navarro et al., 2014) to identified significantly altered proteins comparing IFNγ/EV-endMSCs and EV-endMSCs samples. Protein values (Zq) are reported as the standardized variable, which is defined as the mean corrected log2-ratio expressed in units of standard deviation. Protein ratio of each sample was calculated against an internal standard (IS) based on the average of iTRAQ reporters from EV-endMSCs control samples. Statistical differences between Zq values of samples groups were evaluated by paired t-test. Significant protein abundance change was set at p-value <0.05. EV-endMSCs, Extracellular Vesicles derived from endometrial MSCs; IFNγ/EV-endMSCs, Extracellular Vesicles derived from IFNγ-primed endometrial MSCs; WSPP, Weighted Spectrum Peptide Protein.

