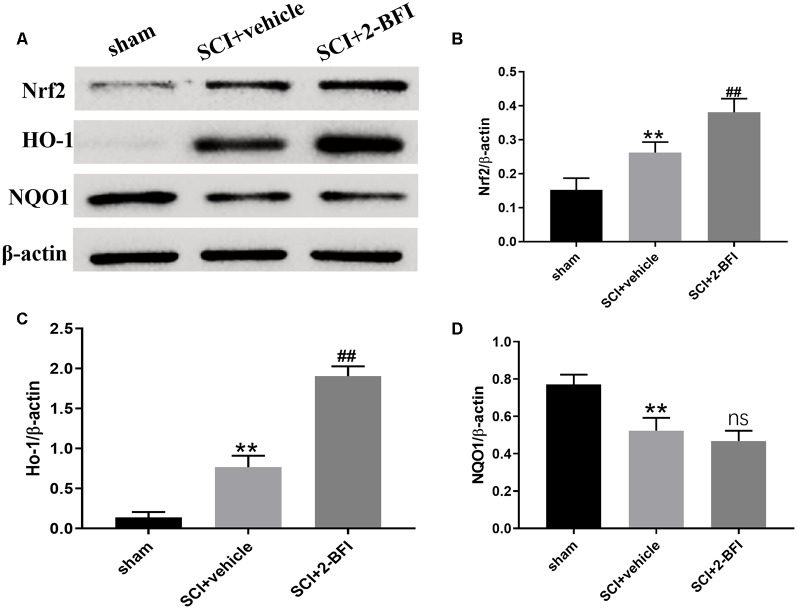
Figure 3.
Expression profiles of the Nrf2, HO-1 and NQO1 proteins in the spinal cord tissue surrounding the damage of each group at 3 days after SCI (A). Western blotting was performed to determine the expression profiles and quantification results of Nrf2 (B), HO-1 (C) and NQO1 (D). Band density was quantified using ImageJ. n = 6 animals per group. Columns represent the mean ± SD. **P < 0.01 vs. the sham group; ##P < 0.01 vs. the SCI+vehicle group; ns, no significance vs. the SCI+vehicle group.

