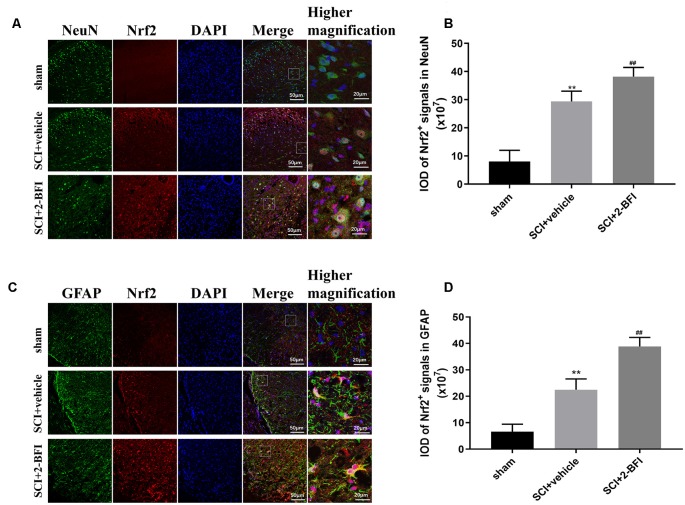
Figure 4.
Double-immunofluorescence staining images of Nrf2 (red) with NeuN (green)-marked neurons (A) and Nrf2 (red) with GFAF (green)-marked astrocytes (C) to show the expression profiles in the sham group, vehicle group and 2-BFI group. Nuclei were counterstained with DAPI (blue) in the same view for each section. Immunofluorescence analysis was used to detect the IOD of Nrf2 signals in neurons (B) and astrocytes (D) at day 3 after the operation. Scale bars are 10 μm. Immunofluorescence intensities were determined using ImageJ software. n = 6 animals per group. Columns represent the mean ± SD. **P < 0.01 vs. the sham group; ##P < 0.01 vs. the SCI+vehicle group.

