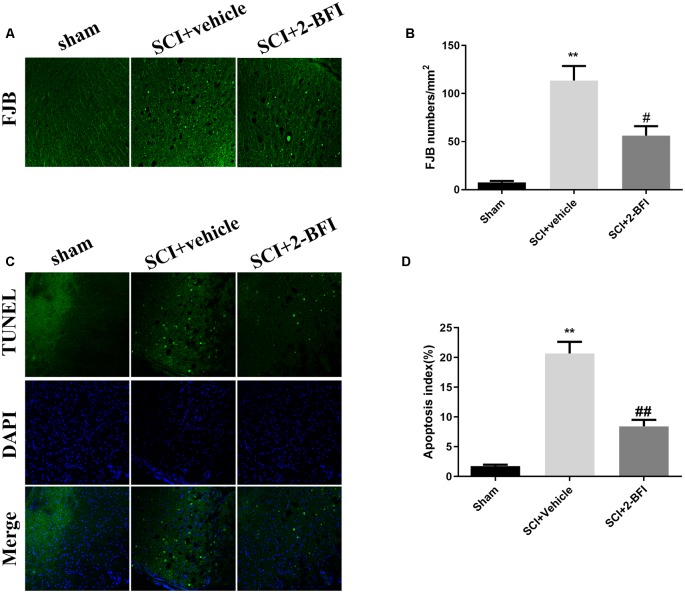
Figure 7.
Evaluation of neuronal death at day 3 after operation. Neuronal death was examined by FJB staining (A). FJB-positive (green) cells per mm2 were quantified accordingly (B). Neuronal apoptosis was examined by TUNEL staining (C). TUNEL-positive (green) cells per mm2 were quantified accordingly (D). Scale bars are 10 μm. The number of positive cells was determined using ImageJ software. n = 6 animals per group. Columns represent the mean ± SD. **P < 0.01 vs. the sham group; ##P < 0.01 vs. the SCI+vehicle group; #P < 0.05 vs. the SCI+vehicle group.

