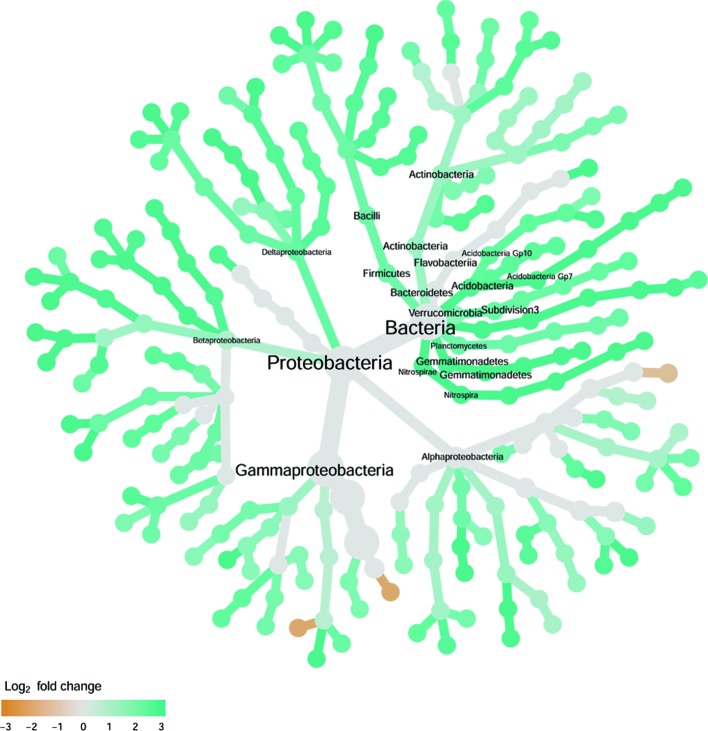
Figure 6.
Tree views of the relative abundance between wilt-tolerant and wilt-susceptible cotton cultivars for endosphere bacteria; the relative difference in abundance is expressed as log2FoldChange with the values indicating that the relative abundance of specific OTUs was greater in the wilt tolerant cultivar samples than in susceptible cultivar samples. The size of nodes represents the abundance of endosphere bacteria at the specific taxonomic rank. Those OTUs that could not be assigned reliably to a taxonomic rank below Kingdom have been excluded from the graph. The graph is drawn with the R package—Metacoder (Foster et al., 2017).

