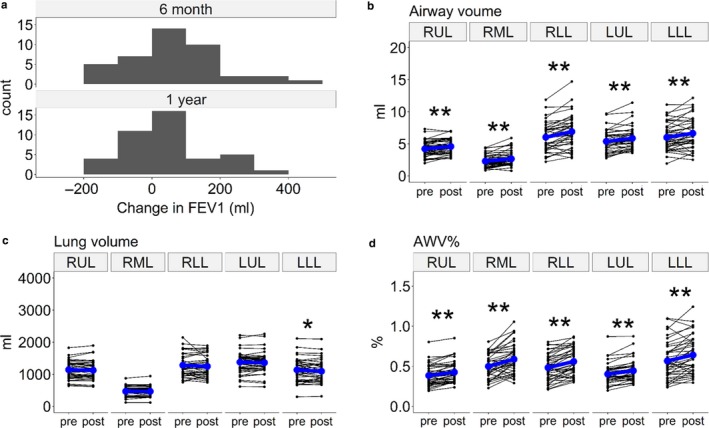
Figure 4.

Changes in lung function and CT measures after bronchodilator treatment. (a) A histogram of the 6‐month and 1‐year changes in forced expiratory volume in one second (FEV1) after starting long‐acting muscarinic antagonist (LAMA) treatment. (b) Airway volume, (c) lung volume, and (d) airway tree to lung volume percentage ratio (AWV%) in the right upper, middle, and lower lobes (RUL, RML, and RLL) and the left upper and lower lobes (LUL and LLL). * and ** indicate p < .05 and p < .01, respectively
