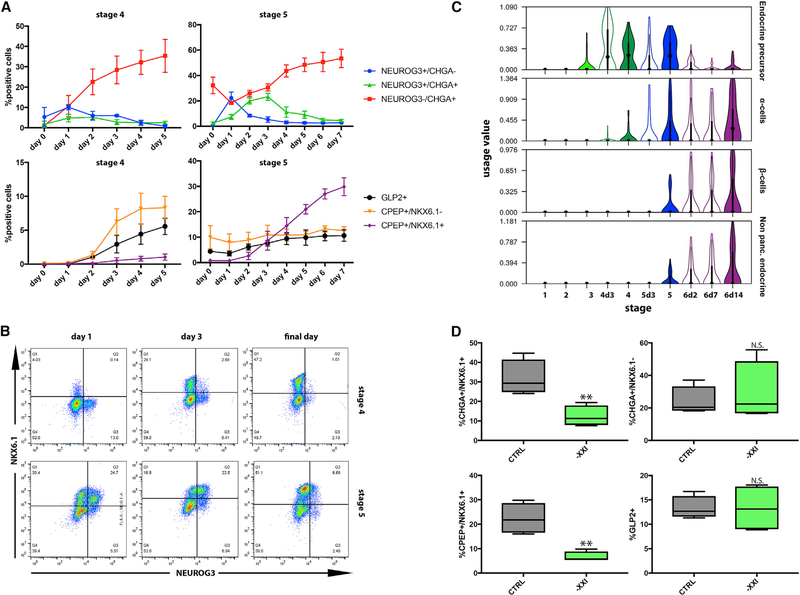
Figure 2. Stages 4 and 5 Produce Different Endocrine Cell Types.
(A) Daily flow cytometry analysis of endocrine Induction during stages 4 and 5. n = 3; data points represent mean ± SD.
(B) Representative flow cytometry plots show the relationship between NKX6.1 and NEUROG3+ expression during stages 4 and 5.
(C) Violin plots present the usage value distributions of endocrine EPs in cells collected in different stages.
(D) Flow cytometry analysis on cells at the end of stage 5, with (control) or without XXI. n = 4; p values, clockwise from top left: 0.0022,0.3933,0.1848, and 0.0066, Student’s t test.

