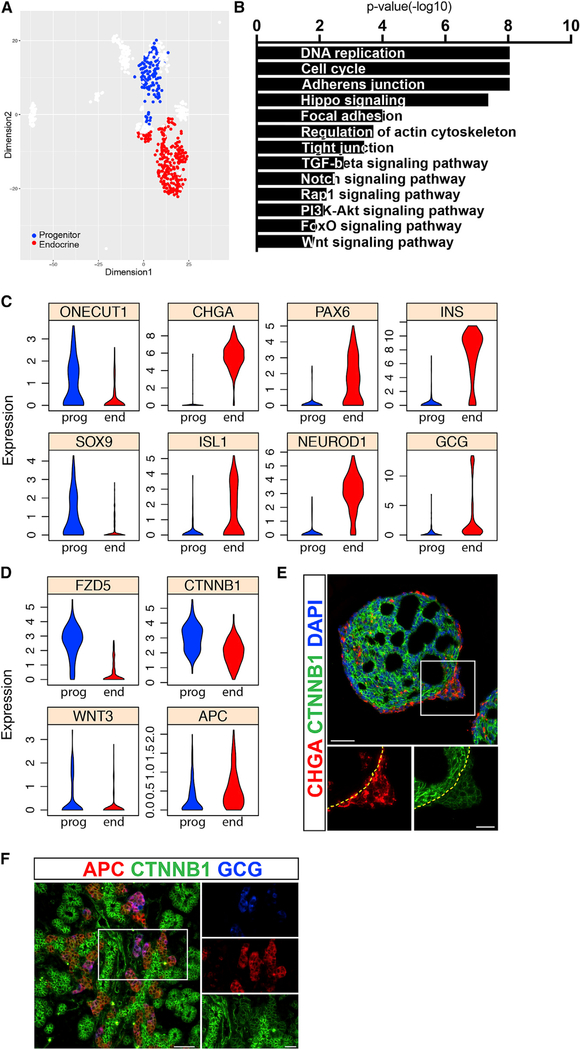
Figure 3. Identification of Genetic Pathways that Separate Progenitors and Endocrine Cells.
(A) SIMLR map presents the cells used for differential expression analysis. Cells with transitory intermediate characteristics were omitted to obtain clearer distinction between the populations.
(B) Representative gene categories enriched in the progenitor compartment.
(C) Violin plots show the expression distributions of various genes in progenitor (prog) and in endocrine (end) cells.
(D) Violin plots show the expression distributions of WNT-pathway related genes in progenitor (prog) and in endocrine (end) cells.
(E) Immunofluorescent staining of clusters at the end of stage 4. Dashed line marks the base of the endocrine bud. Scale bars: 50 μM.
(F) Immunofluorescent staining of a mouse embryonic pancreas at E15.5. Scale bars: 25 μm.

