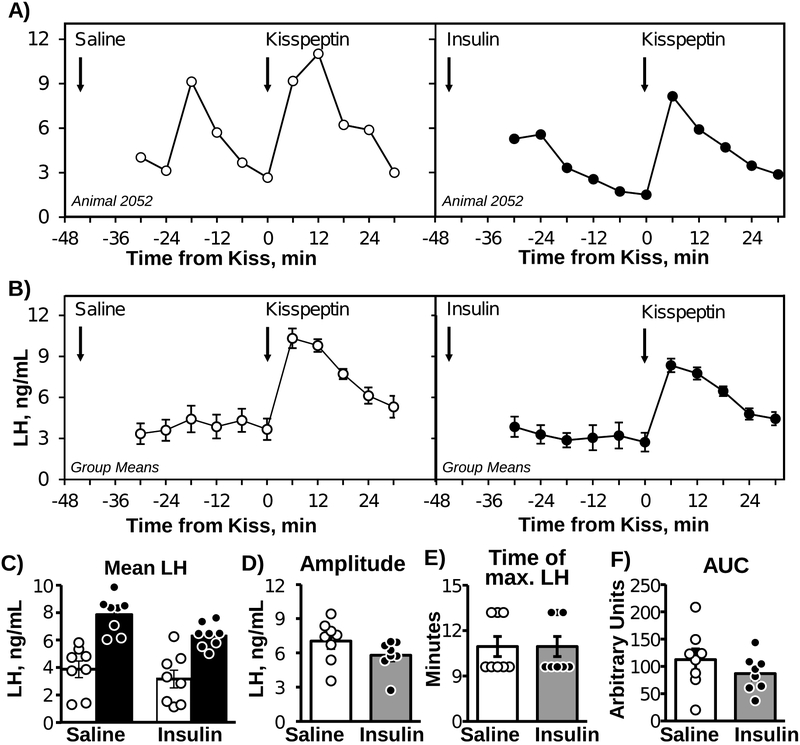
Figure 3:
Representative LH concentration profile from one OVX mouse challenged with kisspeptin, following saline (left) or insulin (right) pretreatment in a cross-over design (A). Mean (±SEM) LH concentrations prior to and in response to kisspeptin challenge following saline (left) or insulin (right) pre-treatment (B) in OVX mice (n=8; cross-over design). Arrows indicate the time of saline or insulin pre-treatment (−45 min) or the time of kisspeptin challenge (0 min). Mean LH before (white bars) and after (black bars) kisspeptin injection (C), change in LH concentration (D), time of maximal LH concentration after kisspeptin injection (E), and area under the curve (AUC) following kisspeptin injection (F).

