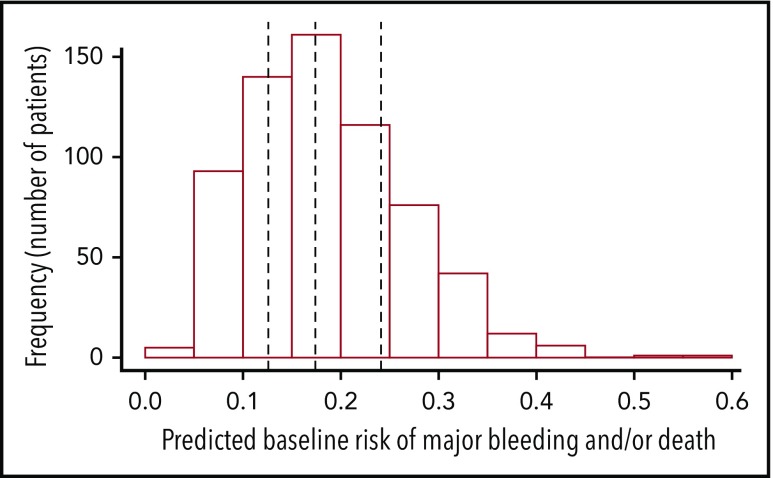
Figure 2.
Distribution of predicted baseline risks of the outcome major bleed and/or death (N = 653). Predicted baseline risk of outcome is represented on the x-axis and the frequency (number of patients) of each predicted baseline risk category (eg, 0%-0.05%, 0.05%-0.1%, and 0.1%-0.15%) in the PlaNet-2 trial population on the y-axis. The vertical lines represent the cutoff points to group patients according to quartiles of predicted baseline risk at 12.6%, 17.4%, and 24.1%.

