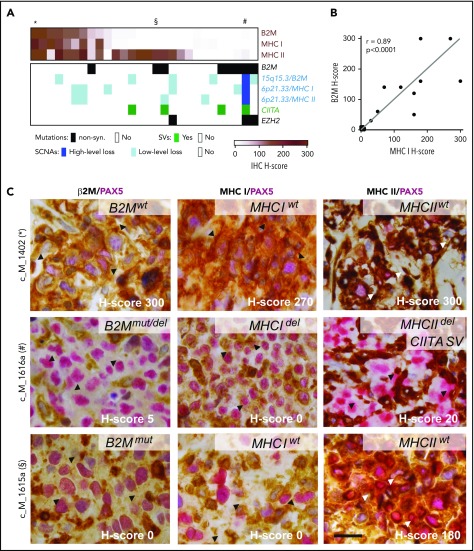
Figure 6.
Expression of β2M, MHC class I, and MHC class II proteins affected by different genetic alterations. (A) Tumor-specific protein expression for β2M, MHC class I, and MHC class II is visualized as color-coded H-score (intensity × percent positive) for all 28 PMBLs with available immunohistochemistry (IHC) data (brown, top panel). Genetic alterations in B2M, MHCI/MHCII, CIITA, and EZH2 color coded by alteration type (key below). Cases depicted in (C) indicated on top with an asterisk, section symbol, and pound sign. (B) Correlation of H-scores of MHC class I and β2M. P values were obtained by using a Spearman correlation test. (C) Representative examples of cases with positive expression of β2M, HLA class I, and HLA class II (top); absence of β2M, HLA class I expression, and decreased HLA class II expression (middle); and absent β2M, HLA class I expression, and positive HLA class II expression (bottom). H-score, lower right corner; genotype, upper right corner. Arrow heads indicate region of interest. Scale bar = 20 μm. del, deletion; mut, mutated; wt, wild-type.

