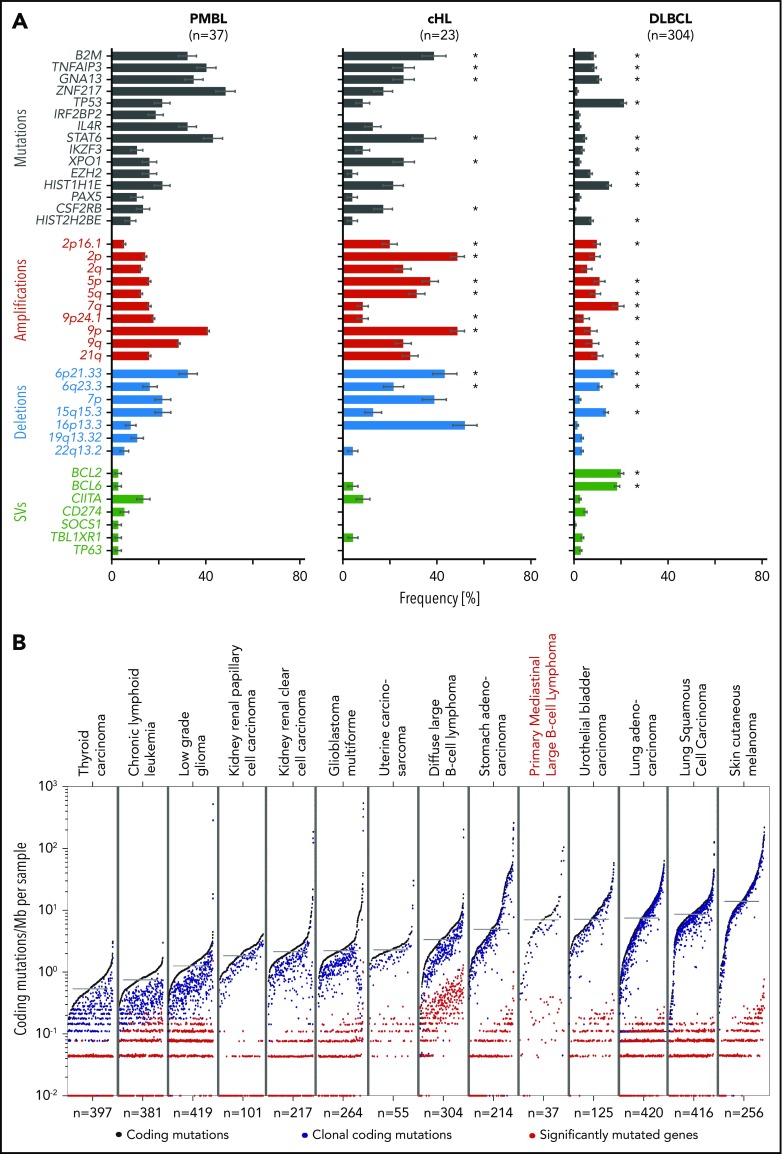
Figure 7.
Comparative analysis of lymphoma drivers and mutational burden. (A) Significant genetic alternations found in PMBL (left panel) are compared with our own reported cohorts of cHL (middle panel),28 and DLBCL (right panel).30 Alterations are color-coded: mutations, black; copy gains (amplifications), red; copy losses (deletions), blue; SVs, green. Error bars indicate standard errors. Because this analysis is PMBL-centric, there are additional DLBCL-specific alterations30 that are not found in PMBL. Note that significantly recurrent somatic alterations in PMBL are not necessarily significantly recurrent in other tumor cohorts despite being observed frequently. Significant genetic drivers in cHL28 and DLBCL30 are indicated with an asterisk. (B) Mutational density across different tumor types, ordered from low to high mutational burden (left to right). Tumor types are ordered by median mutation burden. Coding mutations in black, clonal coding mutations in blue, and significantly mutated genes in red.

