
Figure 5.
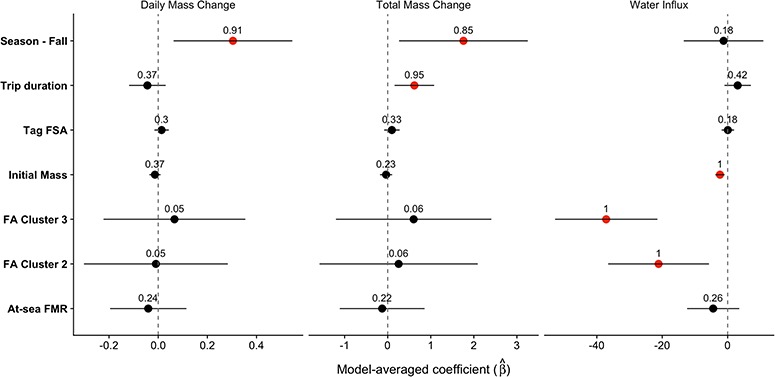
Model averaged conditional coefficients with 95% CI for the daily rate of mass change (kg), total mass change across the foraging trip (kg) and water influx (ml kg−1 day−1). Points are shown in red when the CI did not include zero. Numbers above each point represent the sum of weight for each variable. Intercept estimates (95% CI) are as follows: daily mass change—0.86 (−0.23–1.95), total mass change—−0.05 (−6.17–6.08), water influx—271.5 (195.5–347.6)