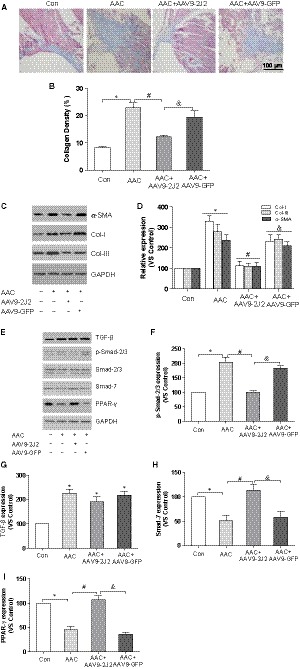
Figure 2.

AAV9‐CYP2J2 reduces atrial fibrosis in mice with AAC. A, Representative images of left atrial (LA) fibrosis (Masson staining, which stains fibre blue, scale bar: 100 μm). B, Percentage of LA fibrosis, n = 5/group. C, Representative immunoblot of α‐SMA, collagen‐I and collagen‐III in left atria. D, Statistical analysis of relative expression of collagen‐I and collagen‐III, n = 3/group. E, Representative immunoblot of TGF‐β, Smad‐2/3 phosphorylation, Smad‐7 and PPAR‐γ in left atria. F, Statistical analysis of relative expression of Smad‐2/3 phosphorylation, n = 3/group. G, Statistical analysis of relative expression of TGF‐β, n = 3/group. H, Statistical analysis of relative expression of Smad‐7, n = 3/group. I, Statistical analysis of relative expression of PPAR‐γ, n = 3/group. Three independent experiments for Western blot, *P < .05, compare with control group; # P < .05, compare with AAC group; & P < .05, compare with AAC + CYP2J2 group
