Figure 4.

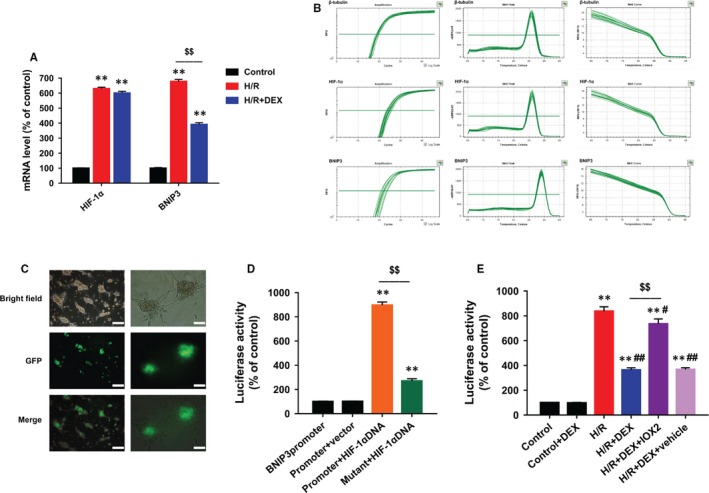
DEX inhibited HIF‐1α‐induced transcriptional activation of BNIP3 expression. A, Quantitative RT‐PCR showing that DEX reduced BNIP3 mRNA, but not HIF‐1α mRNA. B, Amplification, melt peak and melt curve of three genes in RT‐PCR. C, High green fluorescence showing that the cells were effectively transfected. Scale bars: 100 (left row) and 50 µm (right row). D, Dual luciferase reporter gene assay showing that HIF‐1α DNA led to significantly high luciferase activity, which was reduced after transfection with the BNIP3 promoter mutation vector. E, Dual luciferase reporter gene assay showing that DEX blocked the activity of the BNIP3 promoter in the presence of hypoxia‐response elements, which was reversed by IOX2. n = 6. **P < .01 vs control (or BNIP3promoter); #P < .05, ##P < .01 vs H/R; $$P < .01 for the comparisons shown
