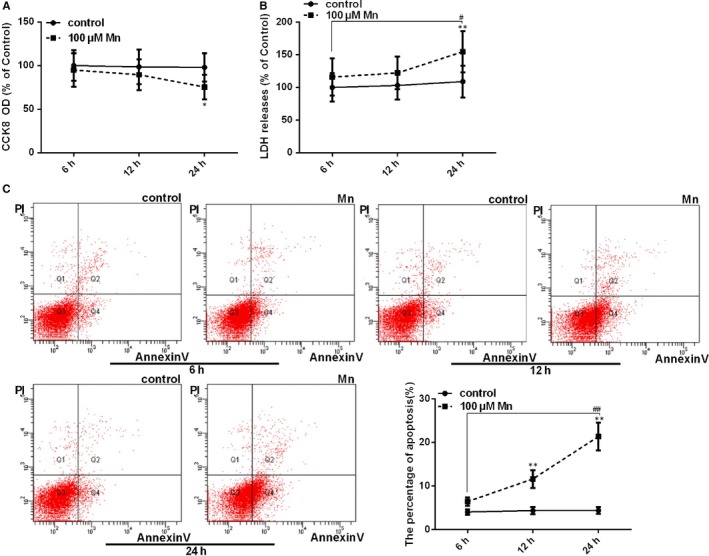
Figure 1.

Manganese induces cell injury and apoptotic cell death in SH‐SY5Y cells. After treatment with Mn for 6, 12 and 24 h. (A) The CCK‐8 assay was used to measure cell viability by using the microplate reader at 450 nm shown in a line graph (B) The LDH release measured using the microplate reader at 490 nm is shown in a line graph. (C) The apoptosis percentage of cells (Annexin V+/PI−, Q4) was regarded as the early apoptosis rate, and the effect on Mn‐induced neural apoptosis is shown in a line graph. *P < .05, **P < .01, compared to controls at the same point, # P < .05, ## P < .01, compared to the cells treated for 6 h
