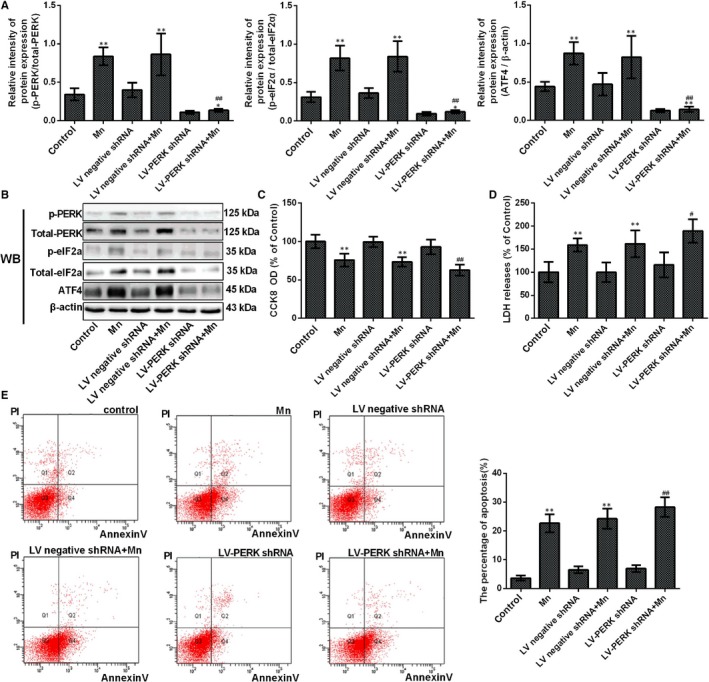
Figure 5.

Protein kinase RNA‐like ER kinase gene knockdown causes SH‐SY5Y cells to be susceptible to Mn. After cells were transfected with PERK shRNA and treated with Mn. (A) The relative ratio of PERK, phospho‐PERK, eIF2α and phospho‐eIF2α and expression of ATF4 are shown in a bar graph. (B) The bands of PERK, phospho‐PERK, eIF2α, phospho‐eIF2α, ATF4 and β‐actin expression levels measured by using Western blotting assay in SH‐SY5Y cells. (C) The CCK‐8 assay was used to measure cell viability by using the microplate reader at 450 nm shown in a bar graph. (D) The LDH release measured using the microplate reader at 490 nm is shown in a bar graph. (E) The percentage of single positive populations (FITC +/PI –) in quadrant Q4 was regarded as the early apoptosis rate, and the early apoptosis in neuron cell by flow cytometry (FCM) is shown in a bar graph. *P < .05, **P < .01, compared to controls; # P < .05, ## P < .01, compared to the 100 μmol/L Mn‐treated group
