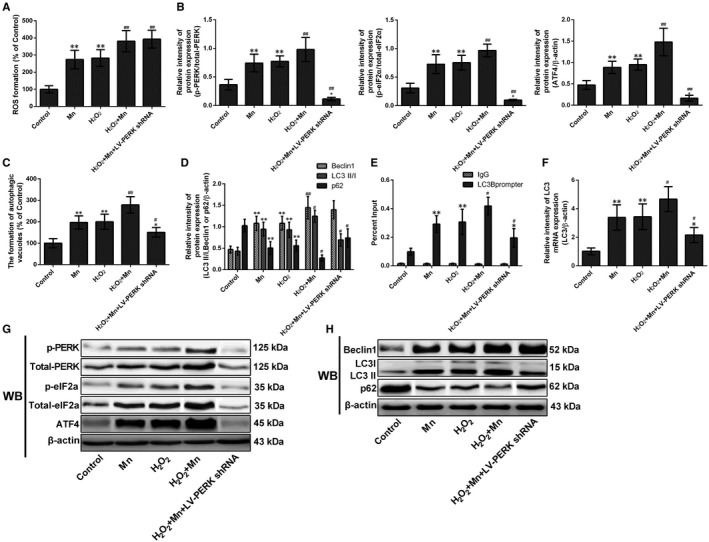
Figure 7.

The interaction of ATF4 to the LC3 promoter is directly regulated by the PERK signalling pathway. After treatment with Mn, H2O2 and LV‐PERK shRNA. (A) The measurement of ROS after staining with DCFH‐DA detected by FCM was shown in a bar graph. (B) The relative intensity of PERK, phospho‐PERK, eIF2α and phospho‐eIF2α and expression of ATF4 are shown in a bar graph. (C) The measurement of autophagic vacuoles after staining with MDC detected by FCM is shown in a bar graph. (D) The protein beclin‐1, LC3 and p62 expressions are shown in a bar graph. (E) The binding of ATF4 to the LC3 promoter by quantitative ChIP analysis shown in bar graph. (F) The expression levels of LC3 mRNA measured by RT‐qPCR assay are shown in a bar graph. (G) The bands of PERK, phospho‐PERK, eIF2α, phospho‐eIF2α, ATF4 and β‐actin expression levels measured by using Western blotting assay in SH‐SY5Y cells. (H) The bands of beclin‐1, LC3, p62 and β‐actin expression levels measured by using Western blotting assay in SH‐SY5Y cells. *P < .05, **P < .01, compared to controls; # P < .05, ## P < .01, compared to the 100 μmol/L Mn‐treated group
