Figure 3.

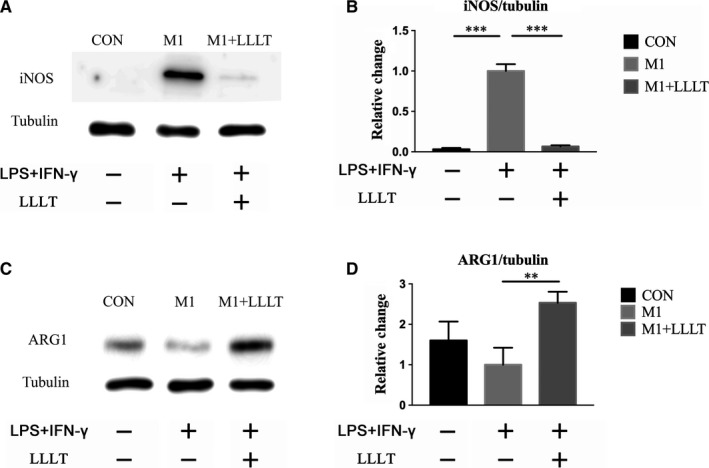
Western blot was used to investigate the expression levels of iNOS and ARG‐1. A and B, Expression level of iNOS. C and D, Expression level of ARG‐1. *P < .05, **P < .01, ***P < .001 compared with the M1 group

Western blot was used to investigate the expression levels of iNOS and ARG‐1. A and B, Expression level of iNOS. C and D, Expression level of ARG‐1. *P < .05, **P < .01, ***P < .001 compared with the M1 group