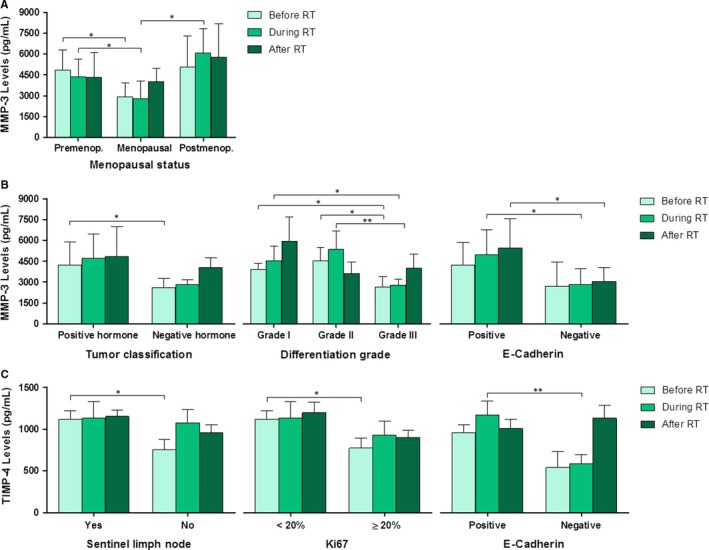
Figure 3.

Serum levels of MMPs and TIMPs before, during and after RT in relation to patient‐dependent variables (A) and tumour biology‐dependent variables (B and C). Only the statistically significant variables are represented. (A) MMP‐3 levels in relation to menopausal status of the patients. (B) MMP‐3 levels in relation to tumour classification, differentiation grade and E‐cadherin presence. (C) TIMP‐4 levels in relation to sentinel lymph node, Ki67 percentage and E‐cadherin presence. Values are presented as median ± SD (error bars); * P < .05 and ** P < .01
